Stock Analysis · Ashland Global Holdings Inc (ASH)
Overview
Ashland Global Holdings Inc. is a specialty chemicals company that develops ingredients and performance materials used by other manufacturers rather than selling directly to consumers. Its products are typically designed to improve texture, stability, solubility, adhesion, protection, or processing performance in end markets such as pharmaceuticals, personal care, coatings, construction, energy, and nutrition. In simple terms, Ashland supplies the “functional ingredients” that help many everyday and industrial products work the way customers want.
The company has become more focused over time, moving away from broader commodity-style chemicals and concentrating on higher-value specialty niches where formulation know-how, regulatory expertise, and customer relationships matter more. That business mix generally aims for better margins and steadier demand than basic chemicals, although Ashland still remains exposed to industrial cycles and shifts in customer inventory levels.
Based on the latest company reporting structure, Ashland’s revenue is mainly generated from the following segments:
- Life Sciences: approximately 35% to 40% of revenue. This segment includes pharmaceutical excipients, controlled-release ingredients, tablet coatings, and nutrition-related ingredients used in health and wellness applications.
- Personal Care: approximately 20% to 25% of revenue. This business supplies ingredients used in skin care, hair care, oral care, and other beauty and cleansing products, often focused on formulation performance and sensory properties.
- Specialty Additives: approximately 20% to 25% of revenue. These additives are used in coatings, construction, automotive, energy, and other industrial applications to improve product performance.
- Intermediates and Solvents: approximately 15% to 20% of revenue. This is the more cyclical and lower-value part of the portfolio, including products tied to solvents and certain chemical intermediates.
The broad financial flow shows a business that has faced several years of shrinking revenue and pressure on profitability. Sales have trended down from about $2.4 billion in fiscal 2022 to roughly $1.8 billion in fiscal 2025, while operating results became much more volatile, including a large operating loss in 2025. That pattern suggests Ashland is still in the middle of a reset rather than operating from a position of consistent stability.
Key Figures
| Metric | Value | Sector ⓘ |
|---|---|---|
| Date | Oct 24, 2026 | |
| Context | ||
| Sector | Basic Materials | |
| Industry | Specialty Chemicals | |
| Market Cap ⓘ | $3.28B | |
| Beta ⓘ | 0.40 | |
Value (Cheapness) | ||
| P/E Ratio ⓘ | 45.96 | 16.92 |
| P/B Ratio ⓘ | 1.77 | 1.66 |
| FCF Yield ⓘ | 9.84% | 5.83% |
| Dividend Yield ⓘ | 2.34% | 2.07% |
| EBIT / EV ⓘ | 4.50% | 6.38% |
| PEG ⓘ | 1.23 | |
Growth (Business expansion) | ||
| Revenue Growth ⓘ | 7.30% | 11.25% |
| RPS Growth (5Y CAGR) ⓘ | 3.46% | 4.49% |
| EPS Growth (5Y CAGR) ⓘ | -21.37% | -15.24% |
| BVPS Growth (5Y CAGR) ⓘ | -2.13% | 5.49% |
| Margin Growth (5Y Trend) ⓘ | -50.56% | -1.54% |
| FCF Growth (5Y CAGR) ⓘ | N/A | 0.37% |
| DPS Growth (5Y CAGR) ⓘ | 9.54% | 5.91% |
Quality (Business durability) | ||
| ROIC (Latest) ⓘ | 3.74% | 9.59% |
| ROA (Latest) ⓘ | 1.13% | 4.92% |
| ROIC (5Y Median) ⓘ | 7.62% | 7.91% |
| ROA (5Y Median) ⓘ | 2.93% | 3.92% |
| Net Debt / EBIT (Latest) ⓘ | 5.48 | 1.36 |
| Net Debt / EBIT (5Y Median) ⓘ | 7.07 | 1.69 |
| Net Debt / EBITDA (Latest) ⓘ | 2.73 | 0.93 |
| Net Debt / Assets ⓘ | 22.63% | 13.69% |
| EBITDA / Interest ⓘ | 6.23 | 12.38 |
| Operating Margin (Latest) ⓘ | 10.26% | 13.24% |
| Operating Margin (5Y Median) ⓘ | 9.66% | 11.82% |
| Debt to Equity (Latest) ⓘ | 78.93% | 40.30% |
| Profit Margin (Latest) ⓘ | 2.82% | 6.38% |
| Free Cash Flow (Latest) ⓘ | $323.00M | |
Momentum (Price trend) | ||
| 3Y Return ⓘ | +1.13% | +73.47% |
| 12M Return (excl. last month) ⓘ | +42.73% | +27.59% |
| 6M Return ⓘ | +27.42% | -4.02% |
| Price vs. 200-Day MA ⓘ | +14.91% | -0.65% |
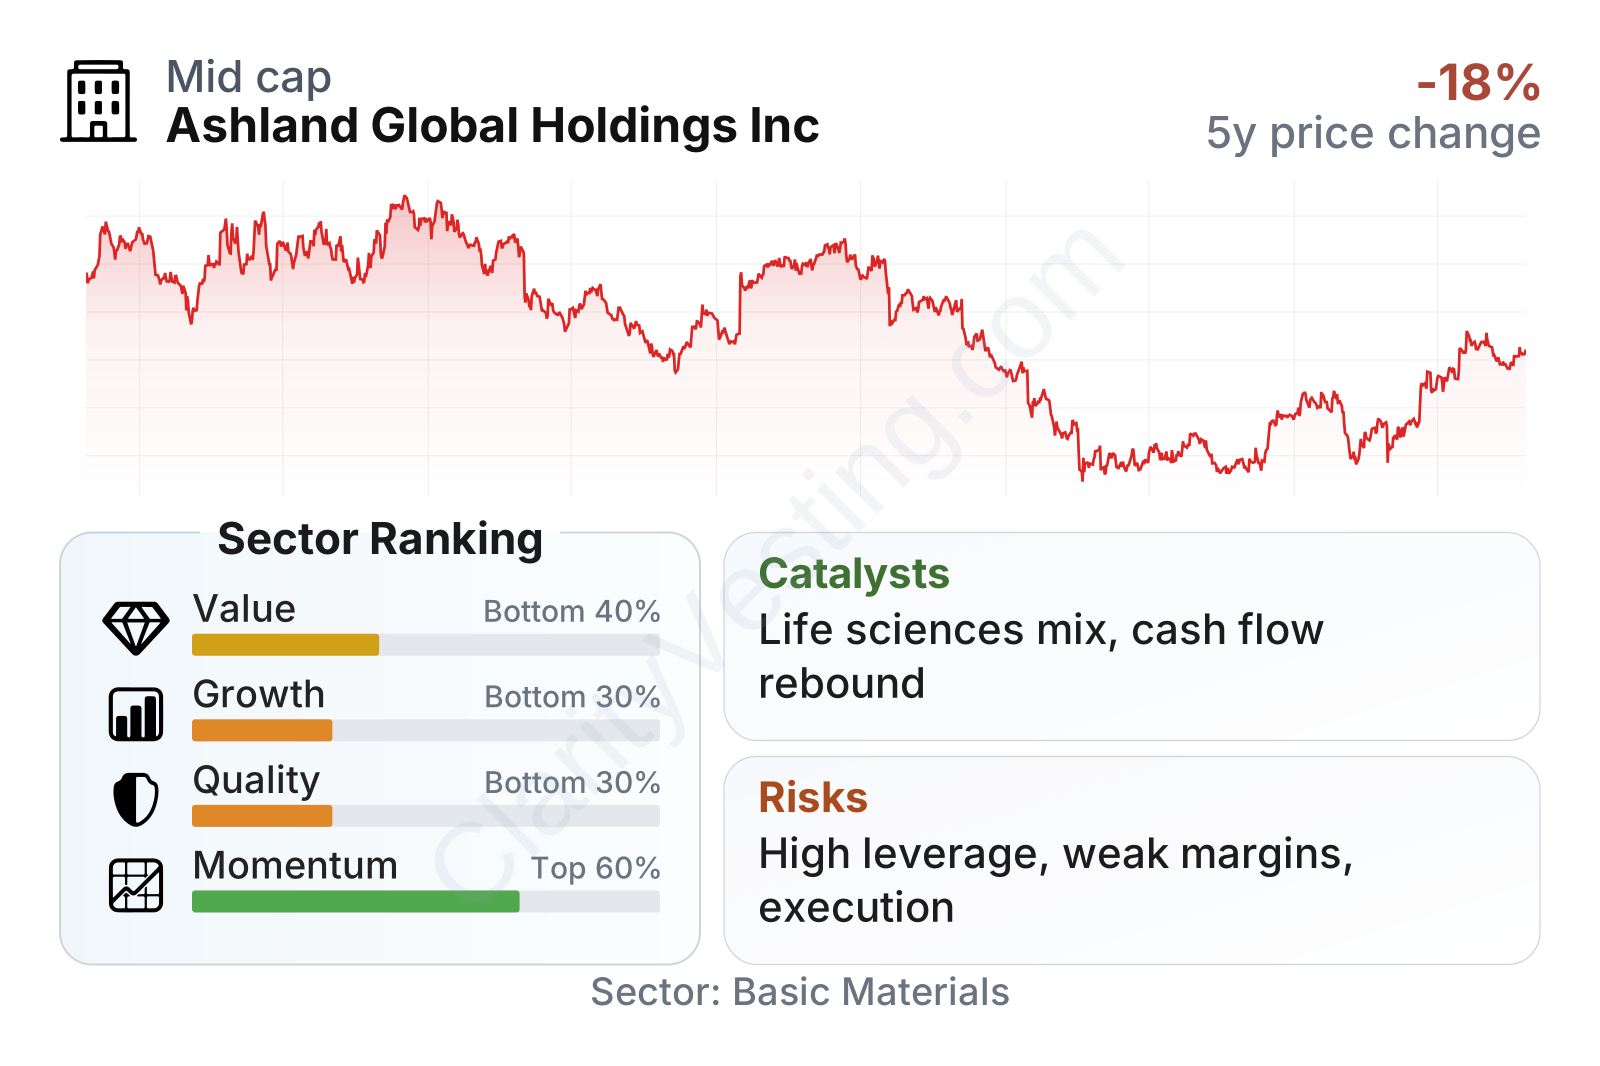
Ashland is a mid-sized specialty chemicals company with a market value a little above $3 billion and a low beta, meaning its share price has historically moved less sharply than the broader market. Even so, the stock’s path has not been smooth. After trading much higher in 2022 and early 2023, the shares fell heavily through 2025 before recovering part of the decline in 2026.
The overall metric profile is mixed. On valuation, the picture is not outright cheap despite a strong free cash flow yield of roughly 10% and a dividend yield around 2.5%, because earnings-based measures remain stretched and operating returns are weaker than many peers. On growth and quality, Ashland ranks in the lower part of its sector, reflecting slow sales expansion over time, weak recent earnings progression, below-median returns on capital, and leverage that is clearly above sector norms. Momentum has improved more recently, with the stock recovering over the last six to twelve months, but that rebound follows a difficult multi-year period.
Growth
Ashland operates in parts of the chemical industry that generally have better long-term characteristics than commodity chemicals. Life sciences and personal care ingredients benefit from structural demand drivers such as aging populations, health and wellness spending, premium beauty products, and the need for highly specialized formulations. These are attractive end markets because customers often value consistency, regulatory support, and product performance more than the lowest possible price.
The company’s strategy also makes sense in principle. Management has been emphasizing a portfolio centered on higher-value, less commoditized businesses, especially pharmaceutical and personal care ingredients. If that transition works, it can improve resilience, pricing power, and margin quality over time. In specialty chemicals, the ability to co-develop products with customers and become embedded in formulations can create sticky relationships that last for years.
That said, recent growth has been uneven rather than strong. Revenue growth turned negative for much of 2023 through 2025 before returning to modest positive territory in 2026. The latest year-over-year trend, around 7%, points to stabilization, but it does not yet prove that the business has entered a sustained expansion phase.
Cash generation is a brighter spot. Free cash flow has been volatile, but the latest trailing twelve-month level is a little above $320 million, which is strong relative to the company’s current market value. That matters because specialty chemicals businesses often need cash to support research, manufacturing upgrades, debt management, and shareholder distributions. A recovery in free cash flow can give Ashland more flexibility even while reported earnings remain under pressure.
Potential catalysts for future growth include further recovery in customer ordering patterns, normalization after inventory destocking in industrial and consumer channels, and better execution in higher-margin segments. In recent company updates, management has also highlighted portfolio actions and cost discipline, which could support earnings if volumes improve. The most significant opportunity is not a single breakthrough event, but a broader return to steadier demand combined with a richer business mix in life sciences and personal care.
Risks
This article is for informational purposes only and does not constitute financial advice. Some content is AI-generated. See Disclaimer


