Stock Analysis · Ares Management LP (ARES)
Overview
Ares Management is a global alternative asset manager. In simple terms, it manages money on behalf of institutions, wealth clients, and other investors, but it focuses mainly on areas outside traditional stock-and-bond mutual funds. Its core activities include private credit, private equity, real estate, and infrastructure. The company earns management fees for overseeing client assets and can also earn performance-based income when investment results meet certain targets.
The business model is built around gathering long-duration capital, putting that capital into specialized strategies, and expanding client relationships across institutional and private wealth channels. Ares has become especially well known for credit investing, an area that has grown as banks have pulled back from some forms of lending and private markets have taken a larger role in financing companies and assets.
Based on the company’s recent reporting, revenue is primarily tied to fee-related earnings and investment performance activity across its major platforms. Ares’ assets under management are led by credit, which is by far the largest platform, followed by real assets, private equity, and secondaries. Using the firm’s platform mix as a practical guide to economic exposure, the business is broadly supported by:
- Credit: about 70%-75% of assets under management. This includes direct lending, liquid credit, alternative credit, and other financing strategies.
- Real assets: about 15%-20%. This includes real estate and infrastructure investing.
- Private equity: about 5%-10%. This includes corporate private equity and related strategies.
- Secondaries and other strategies: low single-digit share. This includes secondary-market solutions and adjacent investment products.
That mix matters because recurring management fees usually follow assets under management, while performance income can be more variable. The company’s economics therefore combine a relatively stable fee base with upside from fundraising, deployment, and realizations.
The long-term financial profile also shows a business that has scaled meaningfully. Revenue has expanded strongly over the past several years, although bottom-line results can move around with interest expense, compensation, and performance-related items. Operating profitability has remained solid even through uneven market conditions, which is typical for large alternative managers with diversified platforms.
The financial flow shows a business that has grown considerably in size, with revenue stepping up sharply by 2025. Operating income stayed strong across the period, but net income remained much lower than operating income because interest expense and other costs absorbed a large share of the economics. That gap is important for understanding why the franchise can look operationally powerful while reported earnings stay more volatile.
Key Figures
| Metric | Value | Sector ⓘ |
|---|---|---|
| Date | Oct 24, 2026 | |
| Context | ||
| Sector | Financial Services | |
| Industry | Asset Management | |
| Market Cap ⓘ | $38.82B | |
| Beta ⓘ | 1.55 | |
Value (Cheapness) | ||
| P/E Ratio ⓘ | 53.92 | 12.46 |
| P/B Ratio ⓘ | 6.96 | 1.25 |
| FCF Yield ⓘ | 2.15% | 9.82% |
| Dividend Yield ⓘ | 4.25% | 2.94% |
| EBIT / EV ⓘ | 5.25% | 8.11% |
| PEG ⓘ | 0.90 | |
Growth (Business expansion) | ||
| Revenue Growth ⓘ | 9.60% | 9.10% |
| RPS Growth (5Y CAGR) ⓘ | 6.22% | 12.31% |
| EPS Growth (5Y CAGR) ⓘ | -7.22% | -6.97% |
| BVPS Growth (5Y CAGR) ⓘ | 18.03% | 5.02% |
| Margin Growth (5Y Trend) ⓘ | -0.55% | -4.00% |
| FCF Growth (5Y CAGR) ⓘ | N/A | 4.71% |
| DPS Growth (5Y CAGR) ⓘ | 24.58% | 8.92% |
Quality (Business durability) | ||
| ROIC (Latest) ⓘ | 12.26% | 9.18% |
| ROE (Latest) ⓘ | 17.17% | 13.93% |
| ROA (Latest) ⓘ | 2.56% | 1.57% |
| ROIC (5Y Median) ⓘ | 11.22% | 7.80% |
| ROE (5Y Median) ⓘ | 17.06% | 12.15% |
| ROA (5Y Median) ⓘ | 1.96% | 1.28% |
| Net Debt / EBIT (Latest) ⓘ | 5.42 | 1.02 |
| Net Debt / EBIT (5Y Median) ⓘ | 6.53 | 0.72 |
| Net Debt / EBITDA (Latest) ⓘ | 5.03 | 0.88 |
| Operating Margin (Latest) ⓘ | 39.05% | 22.30% |
| Operating Margin (5Y Median) ⓘ | 32.52% | 24.50% |
| Debt to Equity (Latest) ⓘ | 374.81% | 59.34% |
| Profit Margin (Latest) ⓘ | 12.11% | 26.42% |
| Free Cash Flow (Latest) ⓘ | $836.15M | |
Momentum (Price trend) | ||
| 3Y Return ⓘ | +35.13% | +95.73% |
| 12M Return (excl. last month) ⓘ | -28.29% | +17.30% |
| 6M Return ⓘ | +4.31% | +6.07% |
| Price vs. 200-Day MA ⓘ | -0.19% | +5.36% |
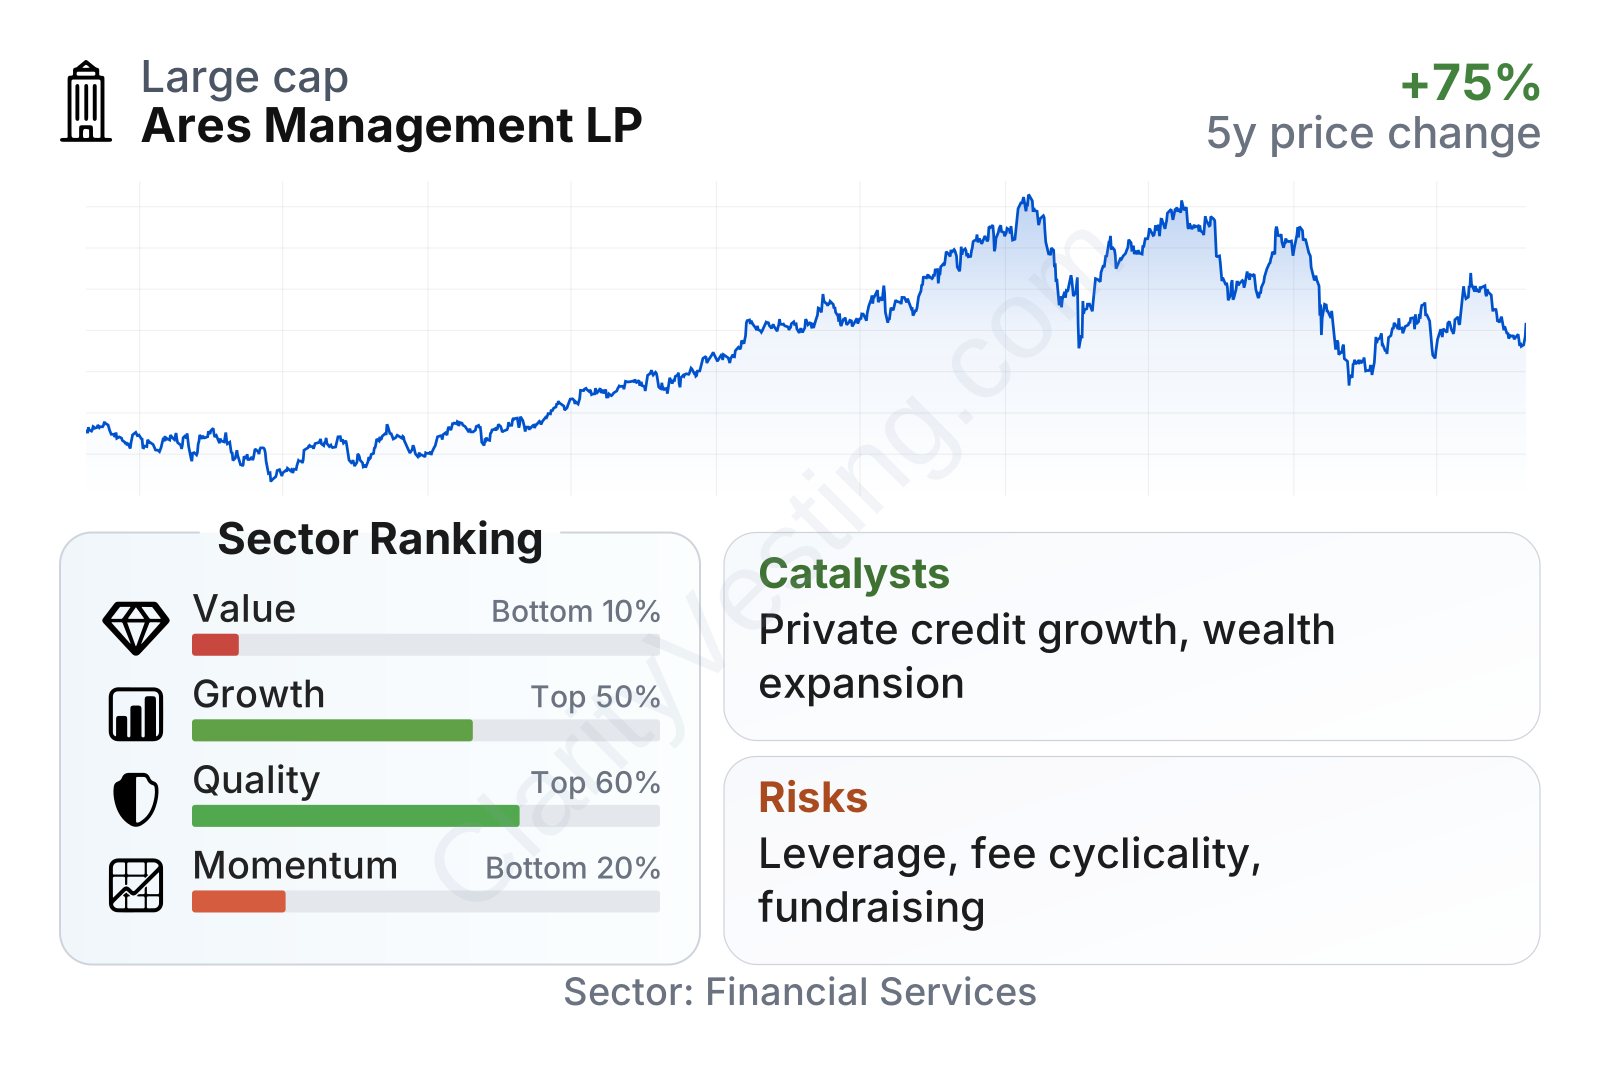
Ares is a large listed alternative asset manager with above-average share-price volatility, reflected in a beta above 1.5. The factor profile is mixed but informative: valuation metrics rank near the bottom of the sector because the stock trades at much higher earnings and book multiples than most financial companies, while quality and growth sit around the upper-middle range. Momentum is weaker, showing that the shares have underperformed much of the sector over the last year even after recovering from a sharp spring drawdown.
The combination is fairly typical for a respected asset manager that the market prices for durability and future expansion rather than current cheapness. Dividend yield is above the sector median, but free-cash-flow yield is notably lower than the median, which suggests the market is placing a premium on franchise value, fundraising ability, and expected earnings progression.
Growth
Ares operates in one of the more attractive corners of financial services: alternative asset management, and especially private credit. This is a growing market because many institutional investors want higher-yielding and less traditional sources of return, while borrowers increasingly use private lenders for speed, flexibility, and scale. That broader shift has been a meaningful tailwind for firms with established underwriting, distribution, and fundraising capabilities.
Ares’ strategy fits that backdrop well. Its strongest position is in credit, where scale matters because it helps the firm source deals, diversify portfolios, and serve a wider range of borrowers and investors. The company has also been expanding across real assets, secondaries, and private wealth distribution, which can deepen fee streams and reduce reliance on any single fundraising cycle.
Its recent earnings trend has been favorable over a multi-year view. Annual earnings per share moved steadily higher from 2021 through 2025, showing that the company has been able to compound through a more difficult rate and capital-markets environment than many financial firms faced.
Book value per share has also risen strongly over time, with especially noticeable improvement since 2023. That matters because it suggests the balance sheet and retained economics have been building even while market conditions have shifted.
The broader growth picture is not perfect, but it is credible. Revenue growth recently has been around the sector median, while five-year revenue-per-share growth has lagged the median. On the other hand, book value per share growth has been far stronger than the sector median, and dividend growth has been particularly robust. That combination points to a company still expanding its economic base, even if the pace is not uniform across every metric.
One notable catalyst is the ongoing institutionalization of private credit. As banks remain more constrained by capital rules and balance-sheet discipline, non-bank lenders such as Ares can continue taking share in corporate and asset-backed financing. Another catalyst is the private wealth channel, where alternative products are reaching a broader client base beyond pension funds and sovereign investors. For Ares, that opens a larger distribution opportunity over time.
Recent company communications have also emphasized fundraising strength, product expansion, and strategic platform development. For a business like Ares, these are important signals because future fee revenue is often built years in advance through capital commitments that are then deployed gradually.
Risks
This article is for informational purposes only and does not constitute financial advice. Some content is AI-generated. See Disclaimer


