Stock Analysis · Algonquin Power & Utilities Corp (AQN)
Overview
Algonquin Power & Utilities Corp is a regulated utility company with operations mainly in the United States and Canada. In simple terms, it owns electricity, water, and natural gas systems that deliver essential services to homes, businesses, and communities. Utility companies are usually valued for the stability of these services because customers keep needing power and water regardless of the economic cycle.
After the sale of its renewable energy business, Algonquin has become much more focused on regulated utility operations. That shift matters because regulated utilities typically produce steadier earnings than merchant power generation, although they usually grow more slowly. The company now centers its strategy on investing in networks and infrastructure that are approved by regulators and then earning an allowed return on that capital.
The company’s revenue is primarily tied to regulated utility activities. Based on recent company disclosures, the business mix is now overwhelmingly regulated, with only limited non-core exposure remaining.
- Electric utility revenue: approximately the largest share, generated from transmission and distribution service for residential, commercial, and industrial customers across several U.S. jurisdictions.
- Water distribution and wastewater services: a meaningful secondary contributor, coming from regulated water systems serving municipalities and local communities.
- Natural gas utility revenue: a smaller but still important source, tied to gas distribution operations in regulated service territories.
- Other utility-related revenue: a limited portion from miscellaneous regulated and service-related activities.
Because the company has been simplifying its structure, the most useful way to understand Algonquin today is not as a diversified renewable developer, but as a mid-sized North American regulated utility platform with electricity as the core economic engine.
The long-term pattern shows a business that kept revenue fairly stable in the low-to-mid $2 billion range, while profitability was much more volatile. Operating income recovered after the difficult 2022 period, and net income turned positive again in 2025, but interest expense remained elevated throughout the period. That highlights the key feature of the current investment case: the underlying utility business is still functioning, yet the path from revenue to bottom-line profit remains sensitive to financing costs and balance-sheet pressure.
Key Figures
| Metric | Value | Sector ⓘ |
|---|---|---|
| Date | Oct 03, 2026 | |
| Context | ||
| Sector | Utilities | |
| Industry | Utilities - Diversified | |
| Market Cap ⓘ | $3.89B | |
| Beta ⓘ | 0.89 | |
Value (Cheapness) | ||
| P/E Ratio ⓘ | 21.04 | 16.80 |
| P/B Ratio ⓘ | 0.91 | 1.48 |
| FCF Yield ⓘ | -1.50% | 0.64% |
| Dividend Yield ⓘ | 5.26% | 3.91% |
| EBIT / EV ⓘ | 4.91% | 5.01% |
| PEG ⓘ | N/A | |
Growth (Business expansion) | ||
| Revenue Growth ⓘ | 3.10% | 6.00% |
| RPS Growth (5Y CAGR) ⓘ | -3.38% | 4.14% |
| EPS Growth (5Y CAGR) ⓘ | -31.45% | -11.39% |
| BVPS Growth (5Y CAGR) ⓘ | -12.46% | 4.29% |
| Margin Growth (5Y Trend) ⓘ | 5.38% | 3.55% |
| FCF Growth (5Y CAGR) ⓘ | -37.48% | -9.10% |
| DPS Growth (5Y CAGR) ⓘ | -13.68% | 4.51% |
Quality (Business durability) | ||
| ROIC (Latest) ⓘ | 3.14% | 6.53% |
| ROA (Latest) ⓘ | 1.08% | 3.19% |
| ROIC (5Y Median) ⓘ | 1.60% | 6.12% |
| ROA (5Y Median) ⓘ | 0.16% | 2.76% |
| Net Debt / EBIT (Latest) ⓘ | 12.43 | 7.15 |
| Net Debt / EBIT (5Y Median) ⓘ | 14.40 | 7.24 |
| Net Debt / EBITDA (Latest) ⓘ | 6.99 | 4.40 |
| Net Debt / Assets ⓘ | 47.26% | 39.16% |
| EBITDA / Interest ⓘ | 2.84 | 4.41 |
| Operating Margin (Latest) ⓘ | 20.76% | 20.93% |
| Operating Margin (5Y Median) ⓘ | 16.27% | 20.18% |
| Debt to Equity (Latest) ⓘ | 143.60% | 140.88% |
| Profit Margin (Latest) ⓘ | 5.87% | 11.32% |
| Free Cash Flow (Latest) ⓘ | -$58.38M | |
Momentum (Price trend) | ||
| 3Y Return ⓘ | +0.91% | +48.75% |
| 12M Return (excl. last month) ⓘ | +3.08% | +11.24% |
| 6M Return ⓘ | -16.09% | -3.69% |
| Price vs. 200-Day MA ⓘ | -14.84% | -1.97% |
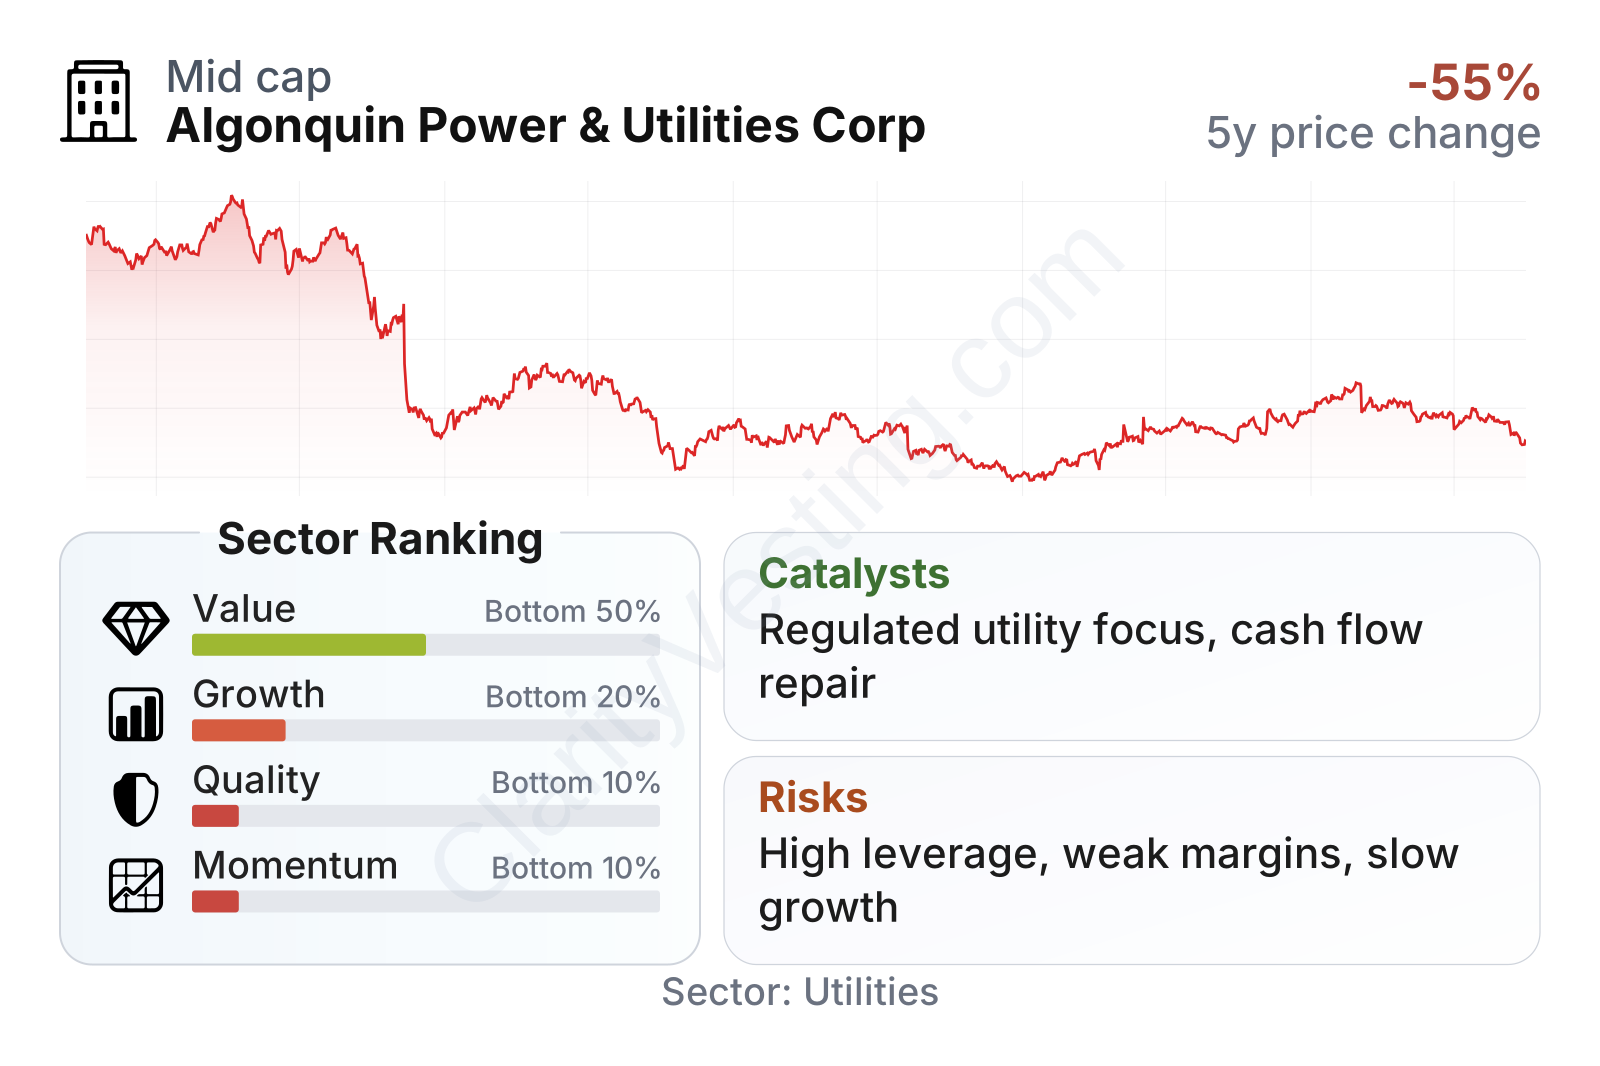
Algonquin is a mid-sized utility with a market value of roughly $4 billion and a beta below 1, which means its shares have historically moved somewhat less than the broader market. Even so, the stock’s own history has been unusually turbulent for a utility, with a steep decline from 2022 into 2025 followed by only a partial recovery in 2026.
The metrics table points to a mixed picture. On valuation, the shares trade above the sector median on earnings, but below the sector median on book value. On income, the dividend yield remains higher than the sector median. The larger issue is that growth, quality, and momentum all rank near the lower end of the utility universe. Profitability is thinner than the sector median, returns on capital are weak, and leverage remains heavy relative to earnings. In short, Algonquin currently looks more like a utility in repair mode than one operating from a position of financial strength.
Growth
Utilities remain a structurally important sector for long-term growth, even if they do not usually grow as fast as technology or consumer businesses. Demand for electricity infrastructure is supported by data centers, grid modernization, local population growth in many service territories, and the rising need for system resilience. Water utilities also benefit from aging infrastructure that requires ongoing replacement and investment.
For Algonquin specifically, the strategic logic is clearer today than it was a few years ago. The company has been simplifying its operations, exiting non-core assets, and focusing on regulated utilities where returns are more predictable. That is a sensible direction because regulated rate base growth can support earnings over time if projects are approved and financed at acceptable costs.
That said, the recent growth record is not strong. Revenue per share has trended downward over the last several years, which shows that the company has not yet translated its repositioning into better per-share expansion. Revenue is still growing modestly year over year, but the longer-term trend remains weaker than the sector median.
Free cash flow has also stayed negative, although the deficit has narrowed considerably compared with earlier periods. For utilities, negative free cash flow is not automatically alarming because these businesses spend heavily on infrastructure. Still, persistent cash outflows mean growth depends heavily on access to debt, equity, or asset-sale proceeds. A healthier long-term setup would be one where investment spending remains high but cash generation improves enough to reduce financing pressure.
A meaningful catalyst is the company’s sharper focus on regulated operations after divestitures. If management can keep recycling capital into lower-risk utility assets, improve regulatory outcomes, and gradually expand its rate base, the business could become easier to understand and potentially more consistent in earnings quality. Another positive factor is that the company returned to positive net income in 2025 after a period of losses and large charges, suggesting the worst of the restructuring phase may be passing.
Recent company updates have also emphasized operational execution, balance-sheet strengthening, and capital discipline rather than aggressive expansion. For a utility in this stage, that is probably the right priority: growth is possible, but credibility first needs to come from steadier results.
Risks
This article is for informational purposes only and does not constitute financial advice. Some content is AI-generated. See Disclaimer


