Stock Analysis · Apollo Global Management LLC (APO)
Overview
Apollo Global Management is a large alternative asset manager. In simple terms, it manages money for institutions and wealthy clients, lends money to companies, invests in businesses and real assets, and earns fees for doing so. It also owns Athene, a major retirement services business that gathers insurance assets and invests them. This combination gives Apollo two engines: fee-based asset management and spread-based retirement income.
The business is generally described through three major areas: Asset Management, Retirement Services, and Principal Investing. Asset Management includes private equity, credit, and real assets strategies managed on behalf of clients. Retirement Services is centered on Athene, which collects premiums and annuity assets and invests them to earn a spread over what it owes policyholders. Principal Investing is Apollo’s own balance-sheet investing activity, which is smaller and more variable than the other two.
Based on Apollo’s recent annual disclosures, revenue is heavily influenced by investment and retirement-related income, so exact mix can move meaningfully from year to year. At a high level, the main economic sources are:
- Retirement Services: approximately 55% to 70% of total revenue in recent years, depending on market conditions and investment income. This includes annuity spread income and other earnings generated by Athene’s large insurance balance sheet.
- Asset Management fees and related income: approximately 20% to 35%. This includes management fees, advisory fees, and performance-related earnings from private equity, credit, infrastructure, and real estate strategies.
- Principal Investing and other income: generally less than 15%, but it can swing because realized gains, marks, and investment exits are not steady from year to year.
Apollo’s model matters because it is not only collecting recurring management fees. It also benefits from insurance float through Athene, which gives it a large and relatively durable pool of capital to invest across credit markets. That structure makes Apollo different from many traditional asset managers and helps explain why its revenue base has become much larger over time.
The long-term trend in the business has been strong top-line expansion, although profitability can be uneven because realized gains, insurance spreads, and market marks can all shift from one period to another. Revenue has moved from roughly $6 billion in 2021 to above $30 billion in 2025, while operating income and net income have also remained sizable despite annual fluctuations.
The revenue base has expanded sharply over the last several years, but the path from revenue to net income is not smooth. That is typical for an alternative asset manager with insurance operations: strong gross economics can coexist with volatile reported earnings because of investment marks, taxes, and changing expense flows.
Key Figures
| Metric | Value | Sector ⓘ |
|---|---|---|
| Date | Oct 03, 2026 | |
| Context | ||
| Sector | Financial Services | |
| Industry | Asset Management | |
| Market Cap ⓘ | $68.54B | |
| Beta ⓘ | 1.51 | |
Value (Cheapness) | ||
| P/E Ratio ⓘ | 42.36 | 12.60 |
| P/B Ratio ⓘ | 131.60 | 1.23 |
| FCF Yield ⓘ | 11.65% | 10.16% |
| Dividend Yield ⓘ | 1.80% | 2.96% |
| EBIT / EV ⓘ | N/A | 7.77% |
| PEG ⓘ | 0.47 | |
Growth (Business expansion) | ||
| Revenue Growth ⓘ | 63.80% | 9.50% |
| RPS Growth (5Y CAGR) ⓘ | 20.32% | 12.10% |
| EPS Growth (5Y CAGR) ⓘ | -8.73% | -9.45% |
| BVPS Growth (5Y CAGR) ⓘ | -27.37% | 5.01% |
| Margin Growth (5Y Trend) ⓘ | -74.94% | -4.07% |
| FCF Growth (5Y CAGR) ⓘ | 65.25% | 4.96% |
| DPS Growth (5Y CAGR) ⓘ | -2.28% | 8.79% |
Quality (Business durability) | ||
| ROIC (Latest) ⓘ | 11.36% | 9.60% |
| ROE (Latest) ⓘ | 14.85% | 13.84% |
| ROA (Latest) ⓘ | 0.40% | 1.53% |
| ROIC (5Y Median) ⓘ | 28.25% | 7.86% |
| ROE (5Y Median) ⓘ | 32.61% | 12.20% |
| ROA (5Y Median) ⓘ | 1.39% | 1.29% |
| Net Debt / EBIT (Latest) ⓘ | -1.67 | 0.91 |
| Net Debt / EBIT (5Y Median) ⓘ | -0.83 | 0.74 |
| Net Debt / EBITDA (Latest) ⓘ | -1.38 | 0.97 |
| Operating Margin (Latest) ⓘ | 21.84% | 22.12% |
| Operating Margin (5Y Median) ⓘ | 21.99% | 24.39% |
| Debt to Equity (Latest) ⓘ | 65.35% | 60.37% |
| Profit Margin (Latest) ⓘ | 5.27% | 26.62% |
| Free Cash Flow (Latest) ⓘ | $7.99B | |
Momentum (Price trend) | ||
| 3Y Return ⓘ | +33.65% | +89.23% |
| 12M Return (excl. last month) ⓘ | -1.73% | +17.35% |
| 6M Return ⓘ | +4.59% | +10.00% |
| Price vs. 200-Day MA ⓘ | -9.21% | +3.73% |
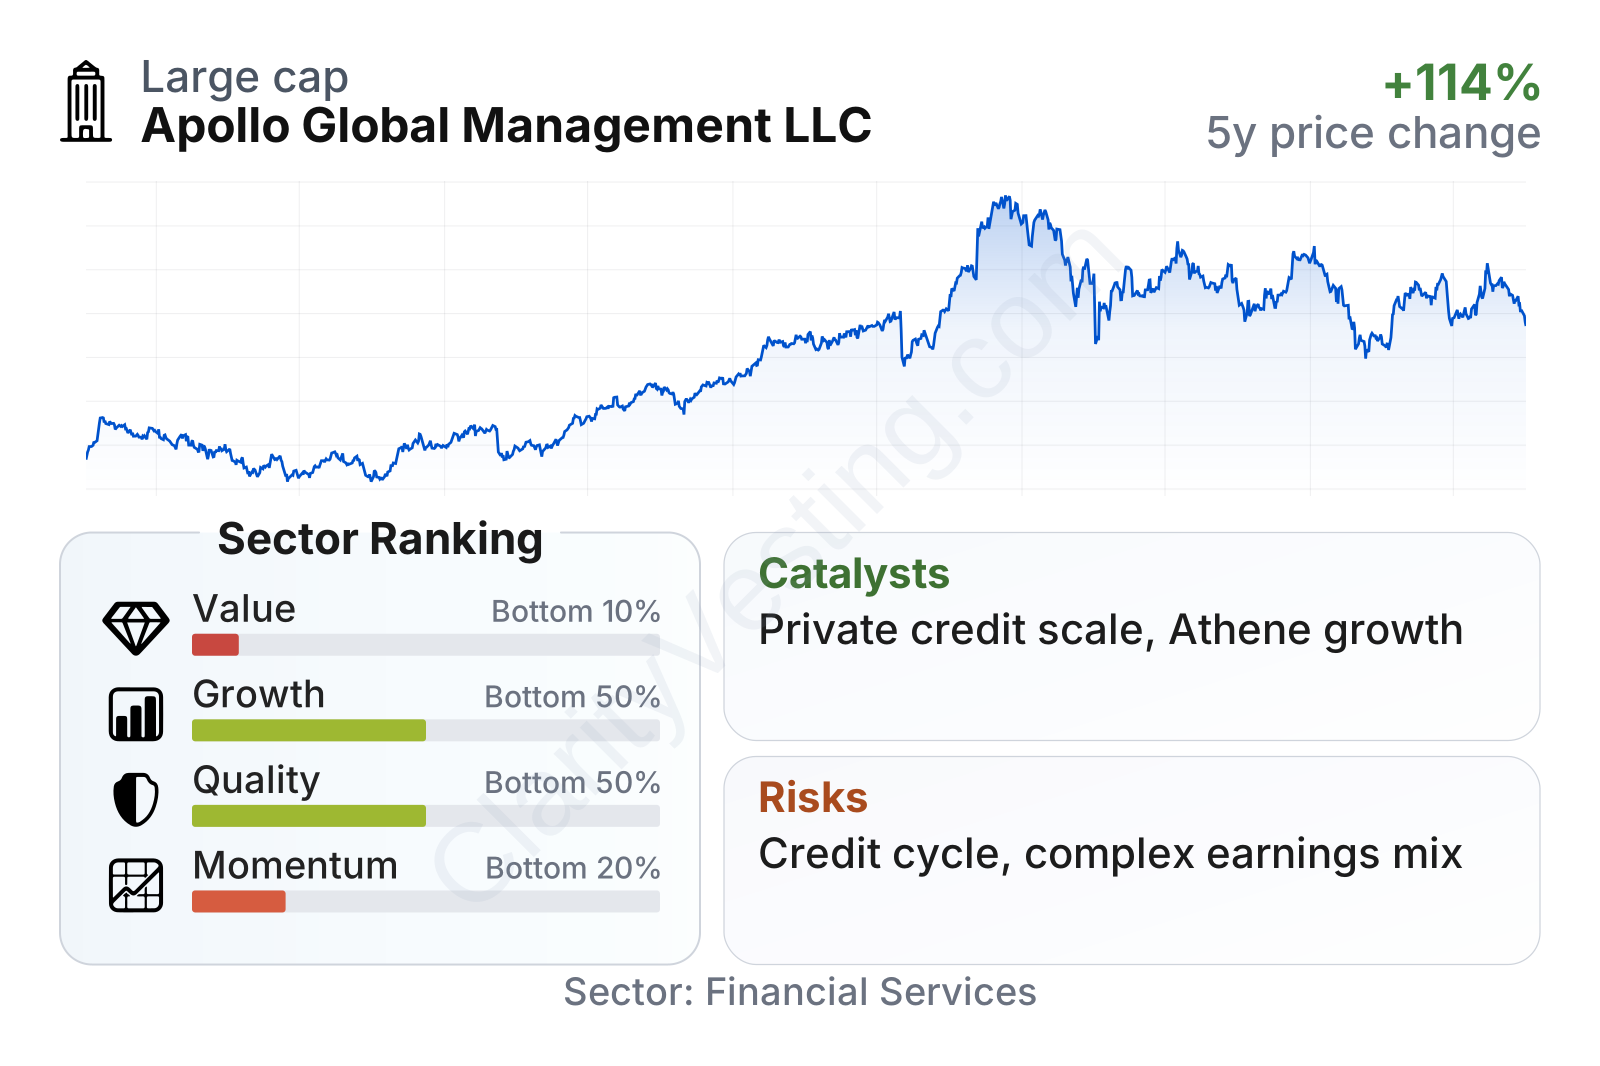
Apollo is a very large financial company, and the stock has been more volatile than the broader market, with a beta above 1.5. The overall profile is unusual: growth measures are relatively strong versus the sector, while value, quality, and momentum rank weaker. In practice, that means the market is paying a premium for expansion potential even though some current profitability ratios and recent share-price trends look less favorable than many peers.
The stock’s multi-year move has been powerful, but it has also included large drawdowns. That pattern fits Apollo’s business model: sentiment can improve quickly when fundraising, deployment, and credit conditions are favorable, then reverse when markets worry about asset values, exits, or insurance-related spread pressure.
Growth
Apollo operates in a part of finance that has grown faster than traditional asset management for years: alternative assets and private credit. Large institutions increasingly want exposure beyond public stocks and bonds, while retirees and insurers need income-oriented products. Apollo is positioned at the intersection of both trends. Its scale in credit and its ownership of Athene give it a powerful capital source that can keep feeding future investments.
Its strategy also makes sense for the current environment. Apollo has focused heavily on origination, meaning it tries to create loans directly rather than simply buying what is already trading in the market. That can improve pricing, deepen relationships, and create a pipeline for its funds and retirement balance sheet. The firm has also expanded into infrastructure, asset-backed finance, and other areas where borrowers need large, flexible capital providers.
Another growth support is the increasing share of recurring fee-related earnings and spread-related earnings. Those streams are usually more durable than depending mainly on private equity exits. That does not remove cyclicality, but it can make the business broader and less reliant on one market window.
Earnings per share have trended upward over the last several full years, moving from the mid-$4 range in 2021 to above $8 in 2025. That progression points to solid business scaling, even if interim results can be uneven.
Book value per share has grown meaningfully over the longer run, though not in a straight line. That pattern reflects both business expansion and the fact that investment marks and capital allocation can move reported equity around from year to year.
Recent corporate developments also support the growth case. Apollo has continued to emphasize private credit, asset-backed finance, and retirement solutions in its public communications, all areas that remain active as banks pull back from some lending categories and institutional demand for yield stays firm. In addition, large fundraising across credit and retirement-linked channels can create a compounding effect: more assets can support more origination, which can support more fees and investment income later.
Risks
This article is for informational purposes only and does not constitute financial advice. Some content is AI-generated. See Disclaimer


