Stock Analysis · Air Products and Chemicals Inc (APD)
Overview
Air Products and Chemicals is one of the world’s largest industrial gas companies. It produces and distributes gases such as hydrogen, oxygen, nitrogen, argon, helium, and carbon dioxide, and it also builds related equipment and large on-site facilities for customers. These gases are essential inputs for industries including refining, chemicals, metals, electronics, manufacturing, food preservation, and healthcare. The business is not glamorous, but it is deeply embedded in many industrial processes, which can make demand relatively steady over long periods.
A large part of the company’s model is based on long-term contracts. In many cases, Air Products builds gas production units next to a customer’s site and then supplies that customer for years under take-or-pay or fee-based arrangements. This usually creates recurring revenue and high switching costs, because customers depend on a continuous gas supply and the infrastructure is specialized.
Based on company reporting, revenue is mainly split between merchant gases, on-site supply, packaged gases, and equipment/services, with geography also being an important lens. Exact percentages move from year to year, but the business mix is broadly concentrated in industrial gases rather than equipment.
- On-site gases and pipeline supply: approximately 45% to 55% of revenue. This includes large customer contracts where gases are produced at or near customer facilities, often under long-term agreements.
- Merchant liquid and bulk gases: approximately 30% to 40% of revenue. These sales cover delivered liquid gases for a wide range of industrial customers.
- Packaged gases: approximately 5% to 10% of revenue. This includes cylinder gas sales for smaller industrial and commercial users.
- Equipment and related services: approximately 5% to 10% of revenue. This covers gasification systems, liquefied natural gas heat exchangers, and other engineering-related activities.
Geographically, the company is diversified across the Americas, Asia, Europe, and the Middle East and India. The mix varies by year, but the Americas are typically the largest contributor, followed by Asia and then Europe, with a growing role for large project activity in the Middle East.
Over the last several years, revenue has stayed around the low- to mid-$10 billion range, while gross profit has remained substantial. The more notable recent change has been profitability volatility, with 2025 results affected by large charges that pushed operating income and net income sharply lower. That matters because it shows the underlying gas business is resilient, but big project execution and accounting charges can still dominate headline results in a given year.
The business structure still points to a company driven far more by recurring industrial gas supply than by one-off equipment sales, which is generally the more durable part of the model.
Key Figures
| Metric | Value | Sector ⓘ |
|---|---|---|
| Date | Oct 03, 2026 | |
| Context | ||
| Sector | Basic Materials | |
| Industry | Specialty Chemicals | |
| Market Cap ⓘ | $62.17B | |
| Beta ⓘ | 0.75 | |
Value (Cheapness) | ||
| P/E Ratio ⓘ | N/A | 17.61 |
| P/B Ratio ⓘ | 5.55 | 1.77 |
| FCF Yield ⓘ | 3.31% | 5.87% |
| Dividend Yield ⓘ | 2.58% | 2.06% |
| EBIT / EV ⓘ | 0.17% | 6.43% |
| PEG ⓘ | 2.07 | |
Growth (Business expansion) | ||
| Revenue Growth ⓘ | 4.60% | 11.30% |
| RPS Growth (5Y CAGR) ⓘ | 3.87% | 4.46% |
| EPS Growth (5Y CAGR) ⓘ | -1.42% | -13.11% |
| BVPS Growth (5Y CAGR) ⓘ | -0.61% | 5.51% |
| Margin Growth (5Y Trend) ⓘ | -27.55% | -1.57% |
| FCF Growth (5Y CAGR) ⓘ | N/A | 0.55% |
| DPS Growth (5Y CAGR) ⓘ | 5.91% | 6.02% |
Quality (Business durability) | ||
| ROIC (Latest) ⓘ | 0.13% | 9.31% |
| ROA (Latest) ⓘ | -0.12% | 4.94% |
| ROIC (5Y Median) ⓘ | 10.90% | 7.91% |
| ROA (5Y Median) ⓘ | 8.07% | 3.93% |
| Net Debt / EBIT (Latest) ⓘ | 123.49 | 1.40 |
| Net Debt / EBIT (5Y Median) ⓘ | 2.17 | 1.70 |
| Net Debt / EBITDA (Latest) ⓘ | 13.24 | 0.91 |
| Net Debt / Assets ⓘ | 42.47% | 13.69% |
| EBITDA / Interest ⓘ | 5.87 | 11.93 |
| Operating Margin (Latest) ⓘ | 1.10% | 13.07% |
| Operating Margin (5Y Median) ⓘ | 24.28% | 11.86% |
| Debt to Equity (Latest) ⓘ | 130.78% | 40.43% |
| Profit Margin (Latest) ⓘ | -0.38% | 6.57% |
| Free Cash Flow (Latest) ⓘ | $2.06B | |
Momentum (Price trend) | ||
| 3Y Return ⓘ | +5.45% | +65.06% |
| 12M Return (excl. last month) ⓘ | +8.02% | +36.05% |
| 6M Return ⓘ | -3.02% | +1.89% |
| Price vs. 200-Day MA ⓘ | -1.85% | +1.03% |
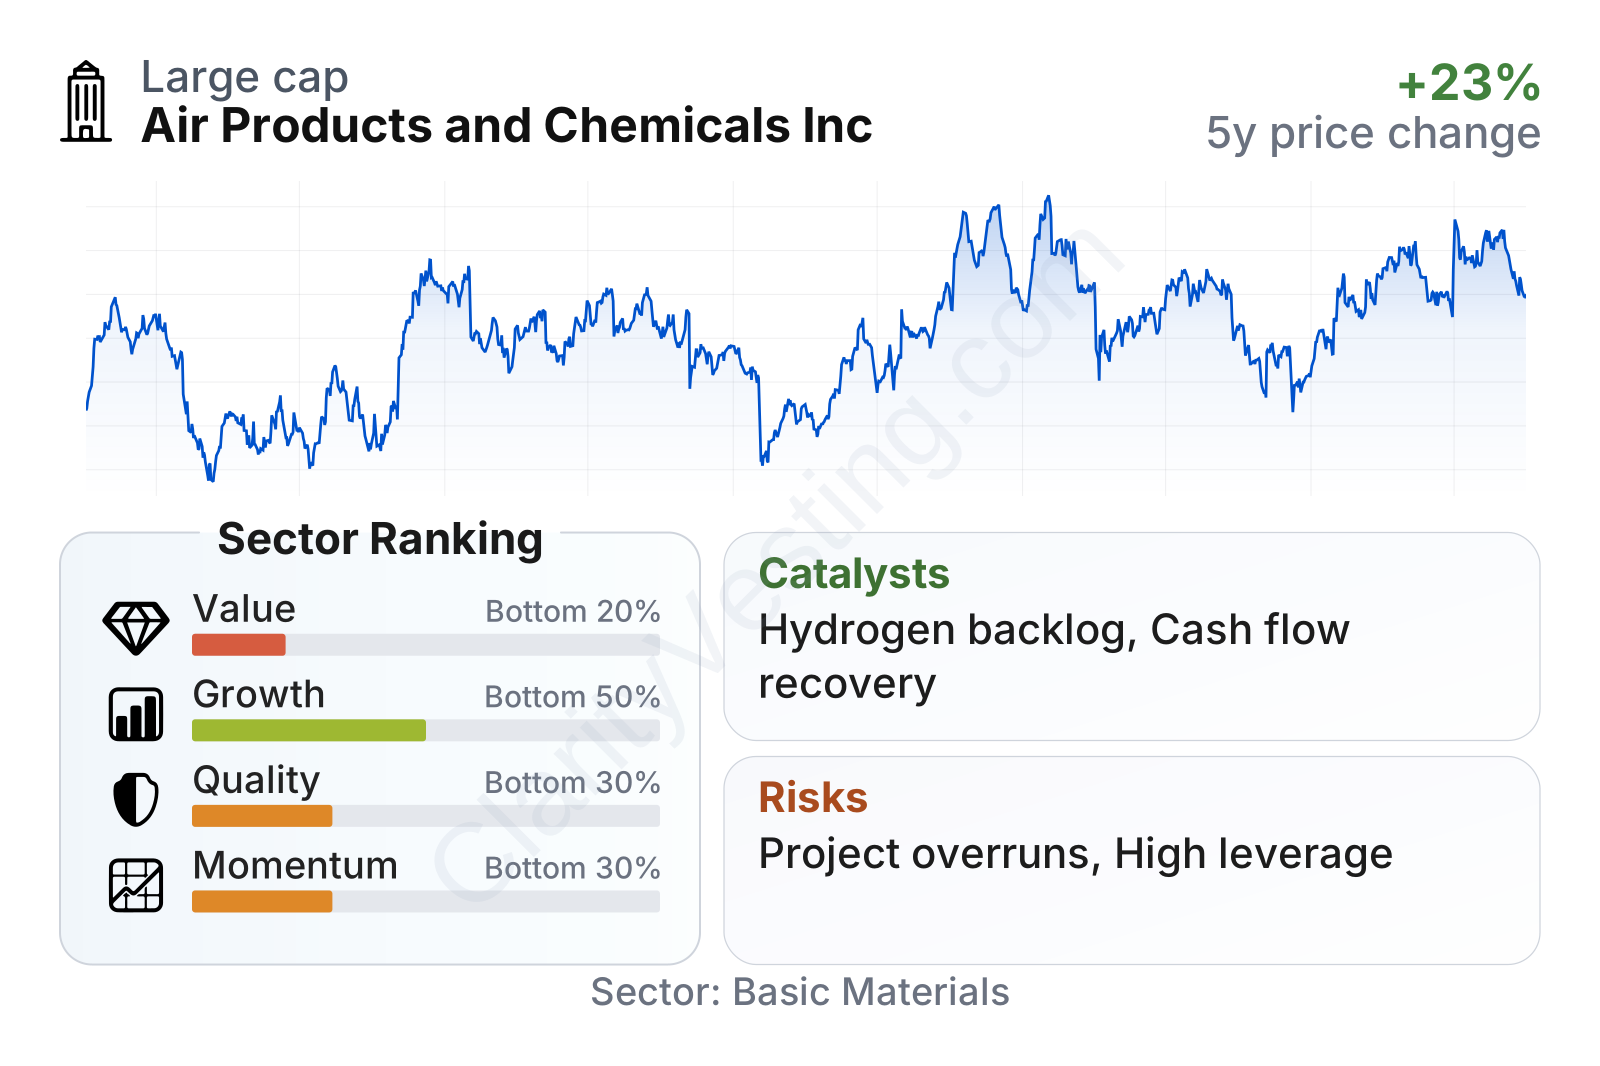
Air Products is a very large company with a market value in the tens of billions of dollars, and its share price has been less volatile than the broader market, reflected by a beta below 1. On quality, the picture is mixed: long-term returns on capital and operating margins have historically been strong for the sector, but recent profitability and leverage metrics are much weaker because of unusual charges and heavy balance sheet pressure. Growth looks modest rather than fast, and momentum has trailed much of the sector. On valuation, the stock does not screen as especially cheap versus other materials names, particularly when judged by cash flow yield and balance sheet-adjusted earnings measures.
Growth
Industrial gases is generally an attractive long-term sector. Demand tends to track broad industrial activity, but some end markets have stronger structural drivers than others. Air Products has focused heavily on hydrogen, carbon capture-related opportunities, gasification, and very large clean energy and industrial infrastructure projects. In principle, that strategy makes sense: hydrogen is central to refining and chemicals today, and it could gain a larger role over time in lower-carbon fuels, heavy industry, and transportation infrastructure.
The company’s strategy is especially centered on large-scale hydrogen and syngas projects. That can create long-duration contracted cash flows if projects are completed on budget and ramp as planned. It also gives Air Products a way to grow beyond the mature parts of the industrial gas business, where volume gains are often incremental.
Revenue growth has been uneven. After a strong rebound period earlier in the decade, sales growth turned negative for several quarters before returning to low single-digit positive territory in 2026. That pattern suggests the core business is stable but not currently expanding at a rapid pace. Compared with the sector median, recent growth has been softer, so the growth case depends more on future project delivery than on current operating momentum.
Free cash flow has also been volatile. It was deeply negative during a period of heavy capital spending, then moved back into positive territory more recently. That rebound is encouraging because it suggests the worst of the cash drain may be easing, but the larger point is that Air Products is in an investment-heavy phase. For a company pursuing multibillion-dollar projects, cash generation can look weak for stretches even when management expects attractive long-term returns.
A meaningful catalyst is the company’s backlog of major projects, particularly in hydrogen and gasification. If these facilities are completed and begin contributing under contracted structures, they could lift revenue quality and earnings visibility for many years. Another growth support is the company’s established presence in sectors that need reliable gas supply regardless of short-term economic cycles, such as electronics, healthcare, and food-related applications.
Recent company disclosures and investor communications have also highlighted management actions to sharpen capital discipline and reassess project execution. That is important because future growth for Air Products is less about finding demand and more about turning very large investments into acceptable returns.
Risks
This article is for informational purposes only and does not constitute financial advice. Some content is AI-generated. See Disclaimer


