Stock Analysis · Artisan Partners Asset Management Inc (APAM)
Overview
Artisan Partners Asset Management Inc. is an investment management company. In simple terms, it runs money on behalf of clients such as pension plans, financial advisors, institutions, and individual investors. The firm offers a range of actively managed investment strategies across global equities, U.S. equities, fixed income, credit, and alternative assets. Its business model is straightforward: clients place assets with Artisan’s investment teams, and the company earns fees based mainly on how much money it manages.
That means the company’s results depend heavily on two moving parts: market levels and client flows. When markets rise or clients add money, assets under management usually increase and fee revenue tends to improve. When markets fall or clients withdraw money, revenue can come under pressure. This makes Artisan more cyclical than many other financial businesses, even though it does not need a balance sheet as large as a bank or insurer.
Based on company filings, the main revenue sources are management and advisory fees, with a much smaller contribution from performance-related fees and other income. A practical way to think about the revenue mix is:
- Investment management and advisory fees: approximately 95% to 99% of revenue. These are recurring fees tied to client assets across mutual funds, separate accounts, and institutional mandates.
- Performance fees and other income: approximately 1% to 5% of revenue. This can include performance-based compensation on certain strategies and miscellaneous operating income.
Within the business, revenue is also indirectly diversified by client channel and strategy mix, but all of it ultimately traces back to the same core engine: fee-earning assets under management. The recent financial path shows a clear rebound after the weaker 2022-2023 period, with revenue, operating income, and net income recovering into 2024 and 2025. Even so, the company remains closely tied to market sentiment and fund flow trends.
The profit structure remains attractive for an asset manager. Revenue has recovered from the 2022 decline, while operating expenses have risen more slowly than revenue over the last two years, helping margins and earnings improve again.
Key Figures
| Metric | Value | Sector ⓘ |
|---|---|---|
| Date | Oct 24, 2026 | |
| Context | ||
| Sector | Financial Services | |
| Industry | Asset Management | |
| Market Cap ⓘ | $2.35B | |
| Beta ⓘ | 1.69 | |
Value (Cheapness) | ||
| P/E Ratio ⓘ | 7.98 | 12.46 |
| P/B Ratio ⓘ | 7.40 | 1.25 |
| FCF Yield ⓘ | 11.05% | 9.82% |
| Dividend Yield ⓘ | 10.50% | 2.94% |
| EBIT / EV ⓘ | 19.76% | 8.11% |
| PEG ⓘ | 1.38 | |
Growth (Business expansion) | ||
| Revenue Growth ⓘ | 8.90% | 9.10% |
| RPS Growth (5Y CAGR) ⓘ | -2.87% | 12.31% |
| EPS Growth (5Y CAGR) ⓘ | -13.52% | -6.97% |
| BVPS Growth (5Y CAGR) ⓘ | -25.10% | 5.02% |
| Margin Growth (5Y Trend) ⓘ | -5.75% | -4.00% |
| FCF Growth (5Y CAGR) ⓘ | -18.72% | 4.71% |
| DPS Growth (5Y CAGR) ⓘ | -10.63% | 8.92% |
Quality (Business durability) | ||
| ROIC (Latest) ⓘ | 63.10% | 9.18% |
| ROE (Latest) ⓘ | 136.86% | 13.93% |
| ROA (Latest) ⓘ | 19.76% | 1.57% |
| ROIC (5Y Median) ⓘ | 63.63% | 7.80% |
| ROE (5Y Median) ⓘ | 217.70% | 12.15% |
| ROA (5Y Median) ⓘ | 17.18% | 1.28% |
| Net Debt / EBIT (Latest) ⓘ | -0.04 | 1.02 |
| Net Debt / EBIT (5Y Median) ⓘ | 0.20 | 0.72 |
| Net Debt / EBITDA (Latest) ⓘ | -0.04 | 0.88 |
| Operating Margin (Latest) ⓘ | 39.49% | 22.30% |
| Operating Margin (5Y Median) ⓘ | 40.23% | 24.50% |
| Debt to Equity (Latest) ⓘ | 67.95% | 59.34% |
| Profit Margin (Latest) ⓘ | 24.08% | 26.42% |
| Free Cash Flow (Latest) ⓘ | $259.86M | |
Momentum (Price trend) | ||
| 3Y Return ⓘ | +34.16% | +95.73% |
| 12M Return (excl. last month) ⓘ | -12.88% | +17.30% |
| 6M Return ⓘ | -6.85% | +6.07% |
| Price vs. 200-Day MA ⓘ | -8.12% | +5.36% |
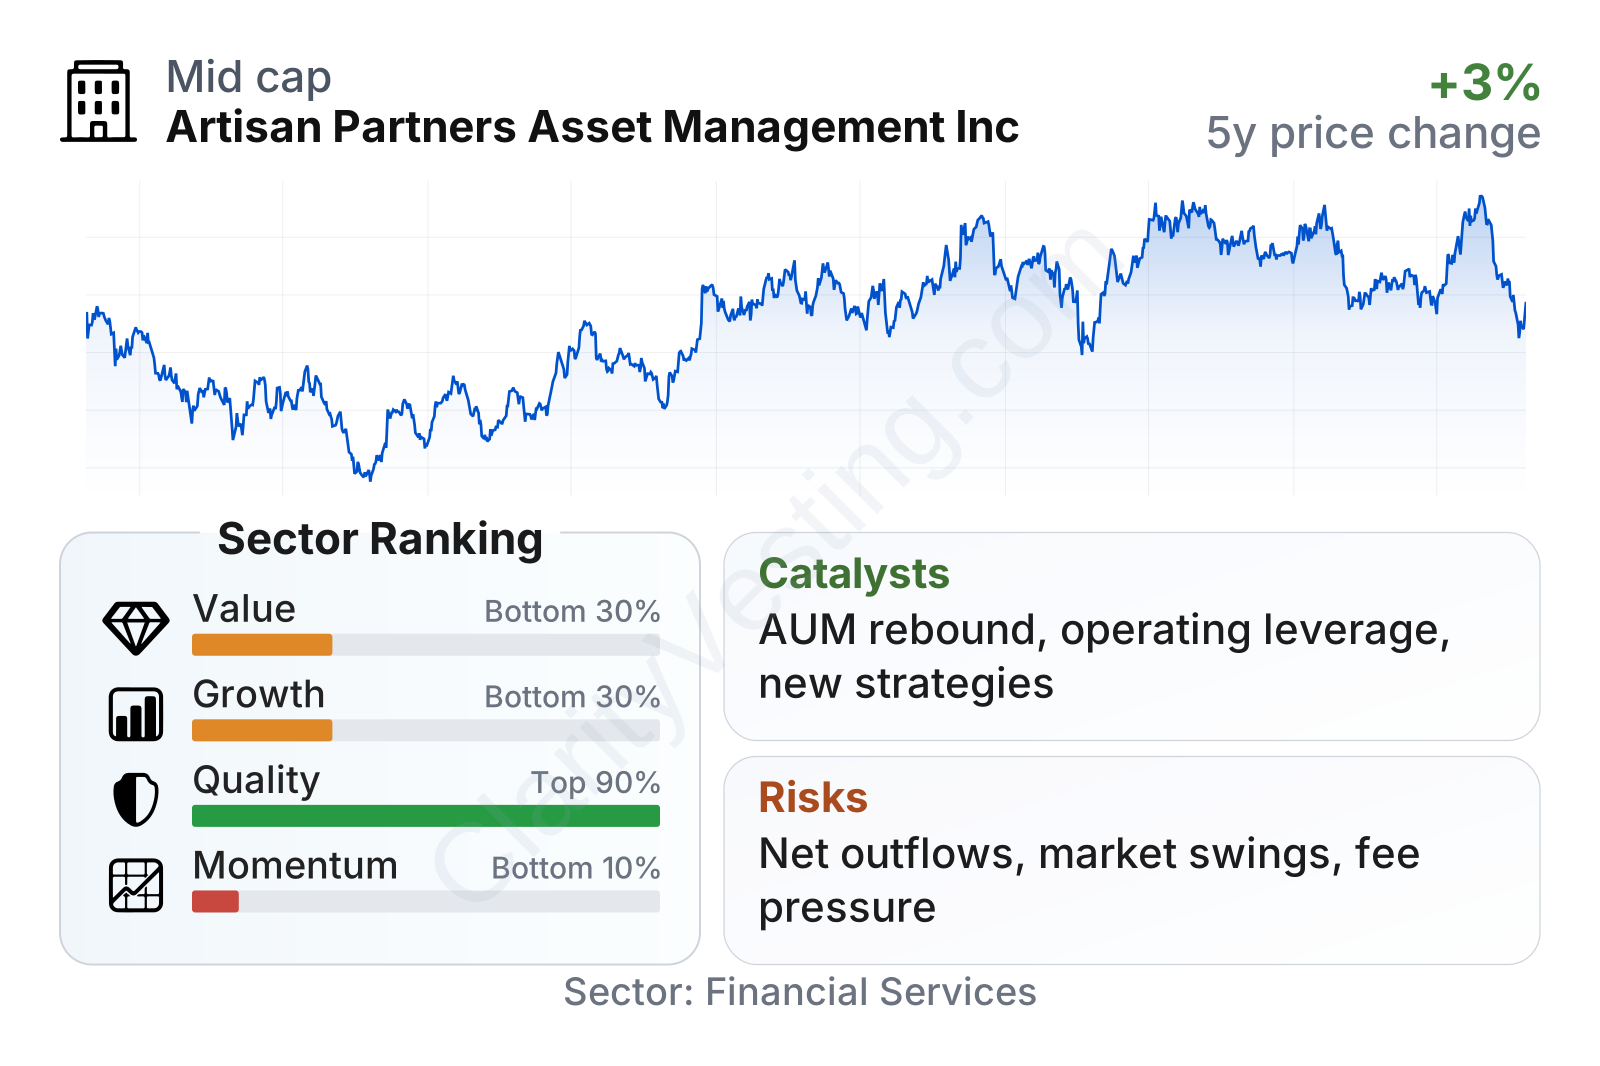
Artisan Partners stands out for business quality more than for broad-based growth or stock momentum. Profitability measures are far above the sector median, and the balance sheet looks conservative with net cash rather than heavy leverage. On valuation screens, the shares look inexpensive on earnings and cash flow, but not on book value, which is less useful here because equity is unusually small relative to earnings power. The weaker areas are longer-term growth, which has been inconsistent, and recent market performance, which has lagged much of the broader financial sector.
The share price history also reflects the nature of the business: sharp weakness in 2022, a strong rebound through parts of 2023 to 2025, and renewed volatility in 2026. That pattern is typical for publicly traded asset managers because their earnings move with markets, client sentiment, and asset flows.
Growth
Asset management is a mature industry, but parts of it are still growing. Long-term expansion comes from rising global savings, retirement assets, demand for institutional outsourcing, and the increasing role of professionally managed portfolios. Artisan is positioned in the active management segment, which is more competitive than plain-vanilla indexing but can still grow if a firm maintains strong long-term investment performance and launches strategies in areas where clients want specialization.
Artisan’s strategy makes sense if viewed through that lens. The firm is built around autonomous investment teams rather than one centralized process. That structure can help attract experienced portfolio managers and gives the company access to niche and higher-value strategies where clients may still pay active fees. The tradeoff is that success depends heavily on maintaining investment talent and performance records.
Recent years show recovery rather than uninterrupted expansion. Revenue grew year over year recently, but the five-year record remains weak, with revenue per share, earnings per share, free cash flow, and book value per share all under pressure compared with earlier periods. In other words, the company has demonstrated rebound potential, but not a smooth compounding pattern.
Earnings per share dropped sharply after the 2021 peak, then began rebuilding in 2024 and 2025. That suggests the business can recover meaningfully when markets and operating conditions improve, but it also shows how exposed profits are to industry cycles.
Book value per share has been unusually volatile and low for a financial company. For an asset manager, this does not necessarily mean the business is weak, because much of its value comes from fee-generating franchises, client relationships, and investment capabilities rather than hard balance-sheet assets. Still, it does help explain why book-value-based valuation measures look stretched.
A meaningful catalyst is the operating leverage in the model. Once a large portion of fixed costs is covered, higher assets under management can translate into disproportionately stronger earnings. If equity markets remain constructive, if investment performance supports better net flows, or if the firm expands successful strategies in areas such as international equities, credit, or alternatives, earnings growth can accelerate faster than revenue growth. Company updates in 2026 have continued to emphasize investment team development and broad strategy coverage, which supports that framework for future expansion.
Risks
This article is for informational purposes only and does not constitute financial advice. Some content is AI-generated. See Disclaimer


