Stock Analysis · APA Group (APAJF)
Overview
APA Group is an Australian energy infrastructure company focused mainly on moving, storing, and processing natural gas. Its assets include gas transmission pipelines, gas distribution networks, gas processing and storage facilities, and a smaller group of electricity transmission and renewable-related assets. This is not a business that depends primarily on selling gas as a commodity. Instead, much of its role is to operate infrastructure that other companies need to transport energy across Australia.
That business model matters for long-term analysis because infrastructure operators often benefit from multi-year contracts, regulated returns, and high barriers to entry. Building long-distance pipelines or distribution networks requires large amounts of capital, permits, land access, and customer commitments, which makes competition difficult once the assets are in place.
Based on the company’s recent reporting structure and asset mix, APA Group’s revenue sources are centered on gas infrastructure, with electricity and other services contributing a smaller share. Exact percentages can vary by year because accounting treatment and asset transactions can materially affect reported revenue, but the business is broadly concentrated as follows:
- Gas transmission: approximately 45% to 55% of revenue. This includes long-haul pipelines that move gas between producing regions, power generators, industrial customers, and local distribution systems.
- Gas distribution: approximately 20% to 30% of revenue. This includes regulated networks that deliver gas to homes and businesses in several Australian regions.
- Gas processing, storage, and related infrastructure: approximately 10% to 20% of revenue. These assets help prepare gas for transport, manage seasonal demand, and support system reliability.
- Electricity transmission, generation, and other energy services: approximately 5% to 15% of revenue. This includes power transmission and selected renewable and grid-support assets.
The recent income flow also shows a business with strong gross profitability but meaningful pressure from financing costs. Revenue has stayed around the low single-digit billions of dollars in recent years, while interest expense has remained large relative to net income. That is typical for capital-intensive utilities, but it is still an important feature of APA’s profile.
One notable pattern is that operating income remains substantial, but a large share of earnings is absorbed by interest expense. That helps explain why cash generation can look healthier than bottom-line profit, while reported earnings remain more volatile.
Key Figures
| Metric | Value | Sector ⓘ |
|---|---|---|
| Date | Oct 17, 2026 | |
| Context | ||
| Sector | Utilities | |
| Industry | Utilities - Regulated Gas | |
| Market Cap ⓘ | $9.40B | |
| Beta ⓘ | 0.27 | |
Value (Cheapness) | ||
| P/E Ratio ⓘ | 64.09 | 17.28 |
| P/B Ratio ⓘ | 4.53 | 1.51 |
| FCF Yield ⓘ | 8.45% | 0.65% |
| Dividend Yield ⓘ | 8.23% | 3.77% |
| EBIT / EV ⓘ | N/A | 5.01% |
| PEG ⓘ | N/A | |
Growth (Business expansion) | ||
| Revenue Growth ⓘ | -12.30% | 6.10% |
| RPS Growth (5Y CAGR) ⓘ | 0.08% | 3.87% |
| EPS Growth (5Y CAGR) ⓘ | -14.15% | -11.30% |
| BVPS Growth (5Y CAGR) ⓘ | -8.47% | 4.23% |
| Margin Growth (5Y Trend) ⓘ | 4.73% | 3.57% |
| FCF Growth (5Y CAGR) ⓘ | -4.22% | -8.84% |
| DPS Growth (5Y CAGR) ⓘ | -9.85% | 4.84% |
Quality (Business durability) | ||
| ROIC (Latest) ⓘ | N/A | 6.53% |
| ROA (Latest) ⓘ | 1.56% | 3.20% |
| ROIC (5Y Median) ⓘ | 4.30% | 5.95% |
| ROA (5Y Median) ⓘ | 1.47% | 2.75% |
| Net Debt / EBIT (Latest) ⓘ | 5.88 | 7.13 |
| Net Debt / EBIT (5Y Median) ⓘ | 11.24 | 7.23 |
| Net Debt / EBITDA (Latest) ⓘ | 3.00 | 4.31 |
| Net Debt / Assets ⓘ | 61.91% | 38.42% |
| EBITDA / Interest ⓘ | 2.99 | 4.58 |
| Operating Margin (Latest) ⓘ | 34.49% | 20.83% |
| Operating Margin (5Y Median) ⓘ | 34.24% | 20.08% |
| Debt to Equity (Latest) ⓘ | 524.38% | 137.69% |
| Profit Margin (Latest) ⓘ | 6.89% | 11.37% |
| Free Cash Flow (Latest) ⓘ | $793.58M | |
Momentum (Price trend) | ||
| 3Y Return ⓘ | +62.52% | +52.37% |
| 12M Return (excl. last month) ⓘ | +55.49% | +8.84% |
| 6M Return ⓘ | +3.11% | -3.95% |
| Price vs. 200-Day MA ⓘ | +14.84% | -0.79% |
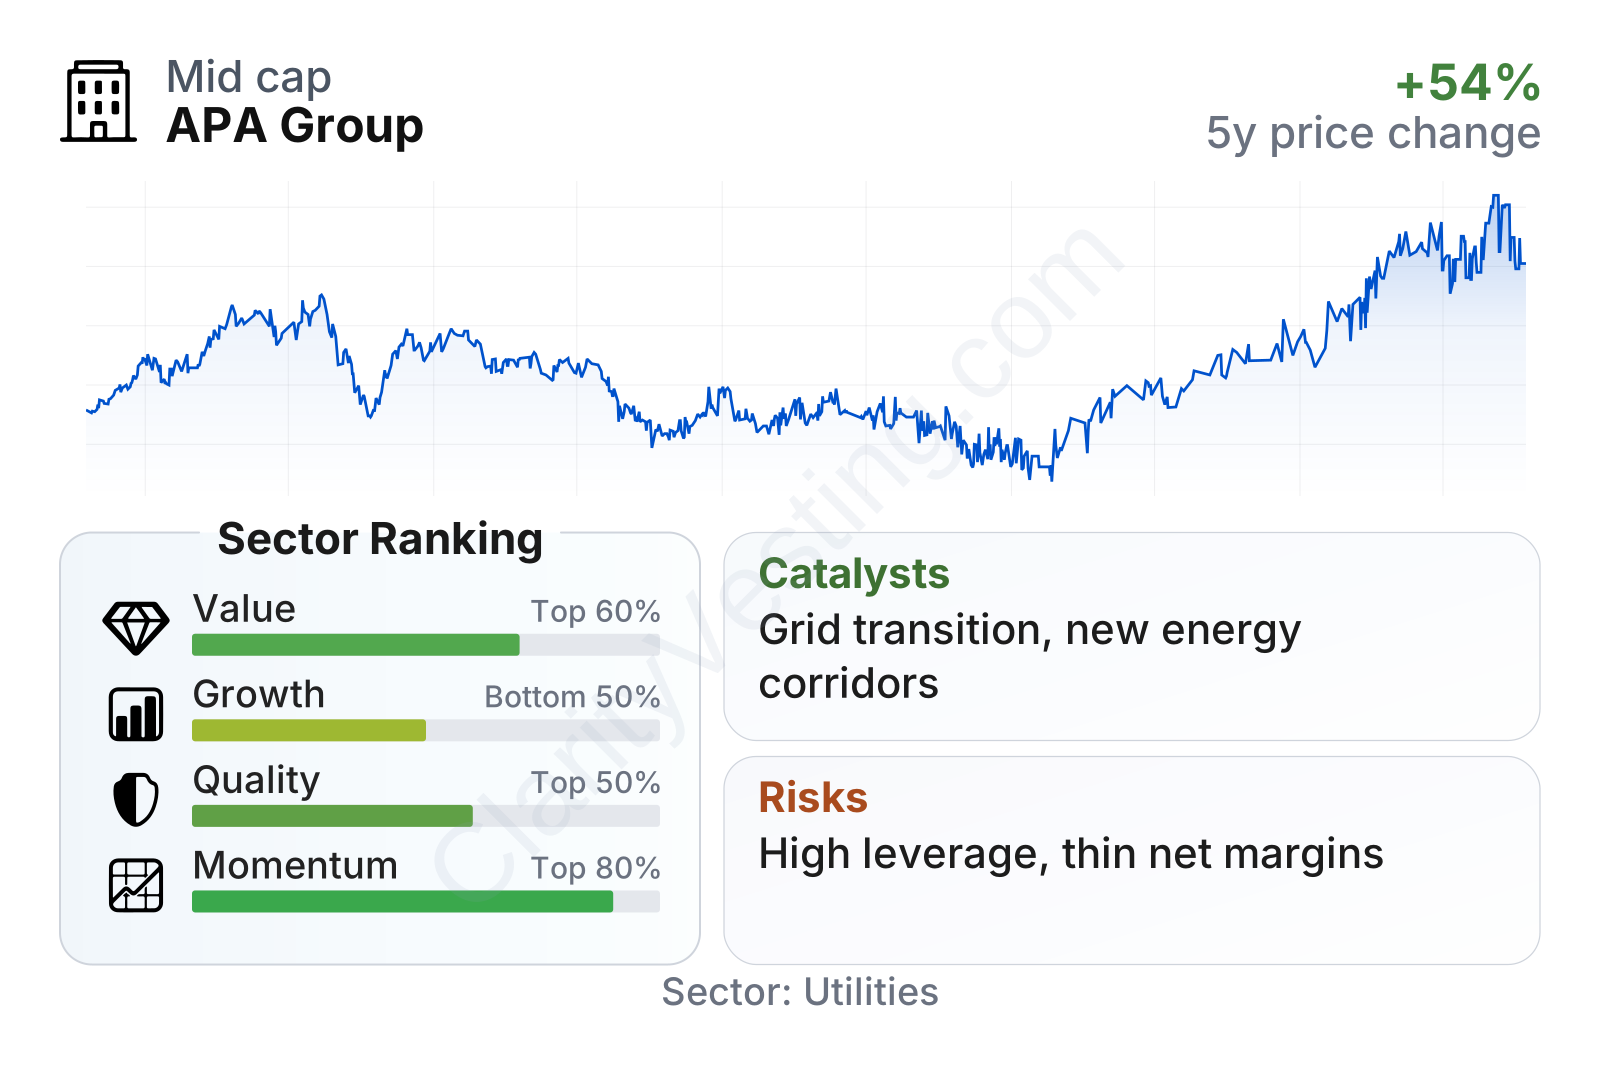
APA Group is a large utility by market value and its share price has shown strong recent momentum, outperforming much of its sector over the last year and over a multi-year period. The stock’s low beta also suggests lower day-to-day volatility than the broader market, which is common for essential infrastructure businesses.
The factor breakdown is more mixed than the price performance suggests. Value metrics look weak on traditional measures such as price-to-earnings and price-to-book, both of which sit well above sector norms, although free cash flow yield and dividend yield stand out more favorably. Growth metrics are soft, with recent revenue declining year over year and longer-term per-share growth close to flat. Quality indicators also show tension: operating margins are strong for the sector, but returns on assets are modest and leverage remains elevated.
Growth
APA Group operates in a sector that should remain relevant for a long time, even as the energy system changes. Natural gas infrastructure still plays an important role in power reliability, industrial demand, and balancing intermittent renewable generation. In Australia, that makes transmission pipelines and storage assets strategically valuable, especially where they connect supply basins with population centers and electricity markets.
The company’s strategy also makes industrial sense. Rather than trying to compete in fast-changing retail energy markets, APA focuses on infrastructure where contracts are longer, replacement is difficult, and customers often depend on the network. It has also been investing in electricity transmission and grid-facing assets, which gives it some exposure to the broader energy transition without abandoning its core expertise in regulated and contracted infrastructure.
Revenue per share has been broadly stable over the last five years rather than strongly expanding. That stability fits the profile of a mature utility, but it also means the growth case depends less on rapid sales expansion and more on disciplined capital investment, tariff resets, new asset development, and efficient financing.
Cash generation is a more encouraging part of the picture. Free cash flow has remained solid in recent periods, supporting the view that the underlying asset base continues to produce meaningful cash even when accounting earnings are uneven. For infrastructure companies, this matters because the ability to fund maintenance, expansion, and financing obligations often says more about resilience than headline earnings alone.
A meaningful catalyst is Australia’s need for transmission, storage, and system-balancing infrastructure as renewable penetration rises. Gas assets may continue to serve as reliability back-up, while electricity transmission and related network investments can create new avenues for capital deployment. APA’s existing footprint gives it a practical advantage when new projects require land corridors, operating know-how, and long-standing relationships with producers, utilities, and large industrial customers.
Recent corporate developments have also kept attention on portfolio optimization and energy transition opportunities. The company has continued to position itself around essential infrastructure rather than commodity exposure, which can support steadier long-term economics if project execution remains disciplined.
Risks
This article is for informational purposes only and does not constitute financial advice. Some content is AI-generated. See Disclaimer


