Stock Analysis · ANI Pharmaceuticals Inc (ANIP)
Overview
ANI Pharmaceuticals is a specialty pharmaceutical company that develops, manufactures, and markets branded and generic prescription medicines. Its business is built around products that serve smaller or more specialized markets where manufacturing know-how, regulatory experience, and focused commercialization matter more than mass-market scale. The company also operates in rare disease through its corticotropin franchise, which has become an important part of the business mix.
Based on the company’s recent filings and operating disclosures, ANI’s revenue comes mainly from the following areas:
- Rare disease and branded products: now the largest contributor, driven primarily by the company’s corticotropin franchise and other branded medicines. This appears to represent roughly 50% to 60% of revenue in the current mix, with corticotropin products being the main driver.
- Generic pharmaceuticals: a broad portfolio of niche and harder-to-make generic drugs, including solid oral products and other specialized formulations. This appears to account for roughly 30% to 40% of revenue.
- Manufacturing, royalties, and other revenue: contract manufacturing, product development support, and smaller ancillary streams. This is the smallest segment, likely in the 5% to 10% range depending on period and product timing.
The business has changed meaningfully in recent years. ANI is no longer simply a small generic-drug company; it is becoming a more diversified specialty drug manufacturer with a larger branded and rare-disease component. That shift matters because branded and specialty medicines generally offer better pricing power and stronger margins than standard commodity generics.
The long-term revenue picture shows a sharp expansion in scale, with sales rising from a little over $200 million in 2021 to nearly $900 million in 2025. Just as important, profitability has improved after earlier losses, although the path has not been perfectly smooth because acquisitions, product launches, and integration costs have affected yearly results.
Key Figures
| Metric | Value | Sector ⓘ |
|---|---|---|
| Date | Oct 24, 2026 | |
| Context | ||
| Sector | Healthcare | |
| Industry | Drug Manufacturers - Specialty & Generic | |
| Market Cap ⓘ | $1.66B | |
| Beta ⓘ | 0.49 | |
Value (Cheapness) | ||
| P/E Ratio ⓘ | 15.64 | 25.42 |
| P/B Ratio ⓘ | 2.71 | 3.08 |
| FCF Yield ⓘ | 9.61% | 3.12% |
| Dividend Yield ⓘ | N/A | 1.85% |
| EBIT / EV ⓘ | 8.74% | 0.56% |
| PEG ⓘ | 1.06 | |
Growth (Business expansion) | ||
| Revenue Growth ⓘ | 25.90% | 7.50% |
| RPS Growth (5Y CAGR) ⓘ | 24.79% | 8.60% |
| EPS Growth (5Y CAGR) ⓘ | 27.45% | -17.73% |
| BVPS Growth (5Y CAGR) ⓘ | -2.75% | 3.72% |
| Margin Growth (5Y Trend) ⓘ | N/A | -0.57% |
| FCF Growth (5Y CAGR) ⓘ | N/A | 0.96% |
| DPS Growth (5Y CAGR) ⓘ | 37.87% | 6.69% |
Quality (Business durability) | ||
| ROIC (Latest) ⓘ | 11.28% | 3.17% |
| ROA (Latest) ⓘ | 7.29% | 2.98% |
| ROIC (5Y Median) ⓘ | -0.41% | 4.56% |
| ROA (5Y Median) ⓘ | -1.69% | 1.87% |
| Net Debt / EBIT (Latest) ⓘ | -0.18 | 1.34 |
| Net Debt / EBIT (5Y Median) ⓘ | N/A | 1.86 |
| Net Debt / EBITDA (Latest) ⓘ | -0.12 | 1.00 |
| Net Debt / Assets ⓘ | -2.00% | 5.06% |
| EBITDA / Interest ⓘ | 7.32 | 9.55 |
| Operating Margin (Latest) ⓘ | 17.38% | 9.25% |
| Operating Margin (5Y Median) ⓘ | -0.75% | 7.33% |
| Debt to Equity (Latest) ⓘ | 55.31% | 26.68% |
| Profit Margin (Latest) ⓘ | 11.07% | 3.34% |
| Free Cash Flow (Latest) ⓘ | $159.44M | |
Momentum (Price trend) | ||
| 3Y Return ⓘ | +29.70% | +51.61% |
| 12M Return (excl. last month) ⓘ | -18.78% | +19.90% |
| 6M Return ⓘ | -7.97% | +10.10% |
| Price vs. 200-Day MA ⓘ | -5.36% | +6.44% |
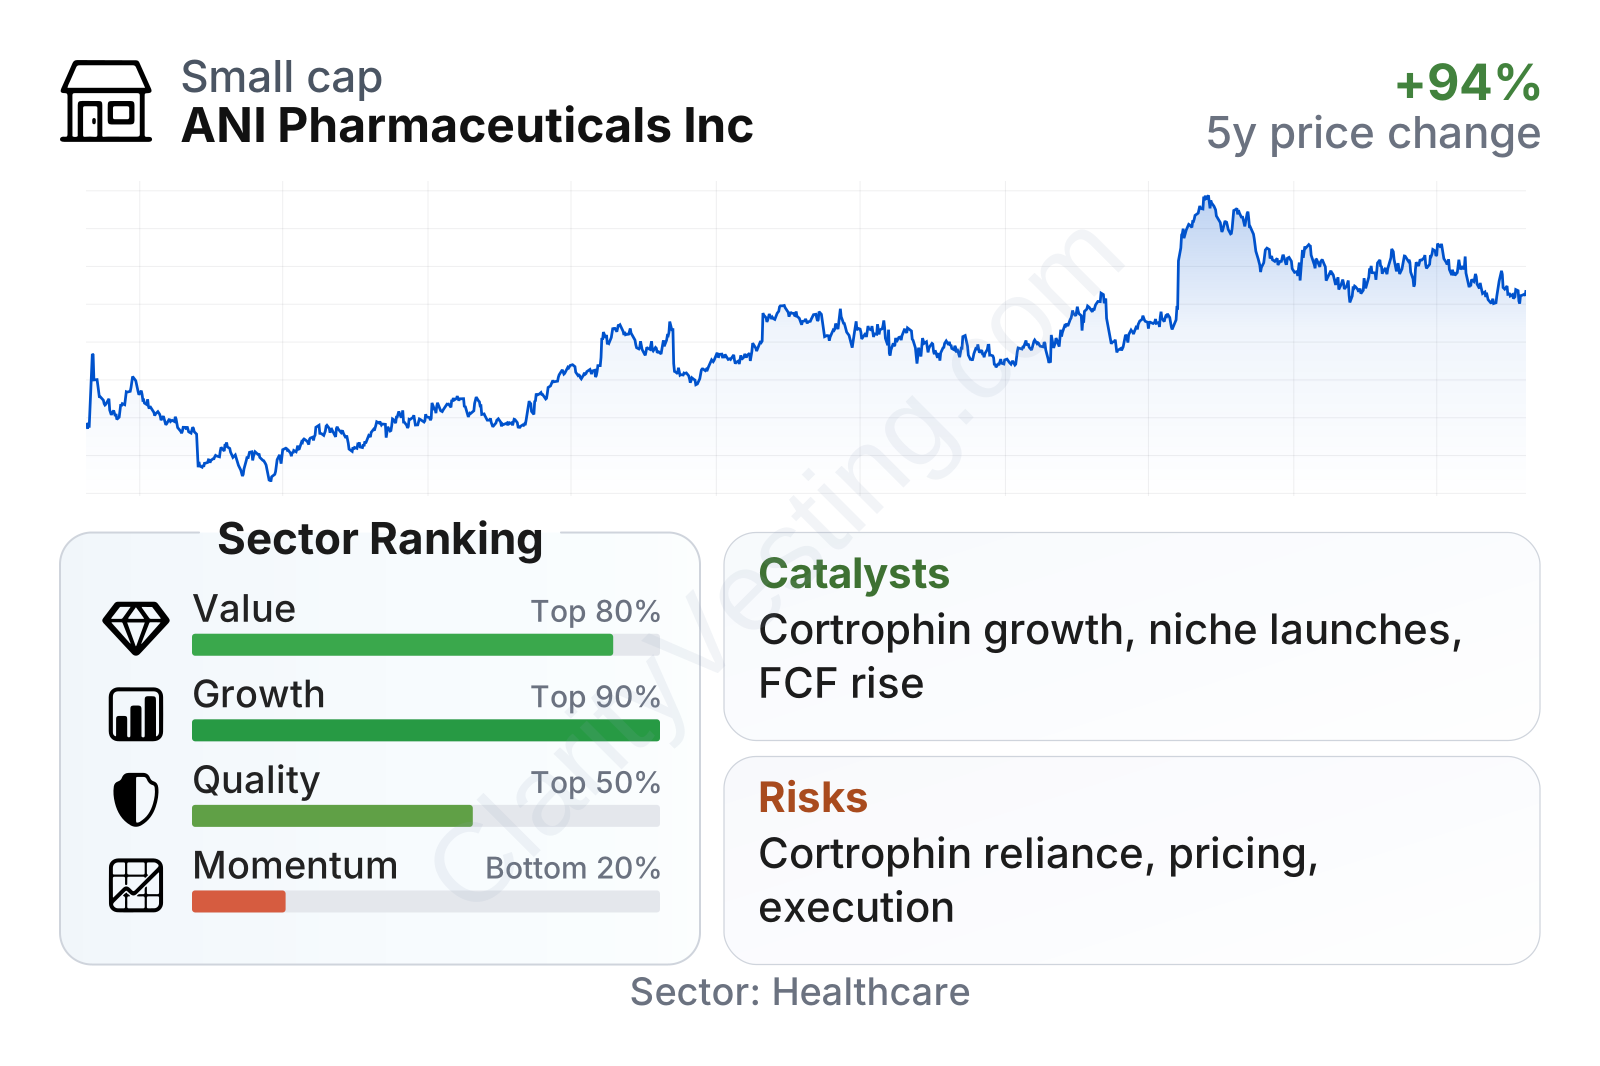
ANI stands out for strong growth, solid current profitability, and cash generation that compares well with much of the healthcare sector. The value profile also looks relatively favorable, with earnings and cash flow multiples below sector medians. The weakest area is recent market momentum, which suggests the share price has lagged despite improving operating performance.
The stock history shows a business that has re-rated upward over several years, but with meaningful swings along the way. That pattern is common for smaller pharmaceutical companies where product launches, regulatory developments, and acquisition integration can move expectations quickly.
Growth
ANI operates in a healthcare niche that still offers room for expansion. Specialty pharmaceuticals, rare disease treatments, and complex generics are all areas where smaller focused companies can grow faster than the broader drug market. Demand is supported by aging populations, ongoing need for off-patent medicines, and the industry’s preference for outsourcing or acquiring specialized manufacturing and development capabilities rather than building everything internally.
The company’s strategy is coherent. ANI has been combining three engines: organic growth from existing products, new launches in generics and specialty medicines, and acquisitions that add commercial assets or manufacturing scale. The addition of a larger rare-disease and branded platform is especially important because it can lift margins and make revenue less exposed to the intense price competition that often hurts plain-vanilla generics.
Revenue growth has remained strong even after the very high post-acquisition comparisons of prior years. Recent year-over-year growth has still been running well above the sector median, which suggests the expansion is not just a one-quarter effect. Over a five-year period, revenue per share growth and earnings growth have also been notably stronger than the typical company in the same industry group.
Cash generation has improved materially. ANI moved from negative free cash flow earlier in the cycle to clearly positive levels more recently, which is an important signal for a company that has been reshaping its portfolio. Better cash flow gives management more flexibility for debt reduction, product investment, manufacturing upgrades, and future business development.
A major catalyst is the company’s corticotropin business, especially Purified Cortrophin Gel. This product has expanded ANI’s exposure to rare disease and specialty prescribing, where commercial relationships and reimbursement execution matter. If adoption continues to broaden across approved uses, it can support both growth and margin improvement.
Another growth driver is the company’s pipeline and launch cadence in niche generics and specialty products. ANI’s model does not require one blockbuster drug to succeed; instead, it can create value by steadily adding products in markets where fewer competitors are active because manufacturing is difficult, volumes are smaller, or regulatory work is more demanding.
Recent company updates have also pointed to ongoing portfolio expansion and operational execution rather than retrenchment. For a business of ANI’s size, that is significant: it suggests management still sees a meaningful runway rather than a mature, low-growth asset base.
Risks
This article is for informational purposes only and does not constitute financial advice. Some content is AI-generated. See Disclaimer


