Stock Analysis · Amrize Ltd (AMRZ)
Overview
Amrize Ltd operates in building materials, a part of the broader basic materials sector that supplies products used in construction, renovation, and infrastructure. In practical terms, this means the company sells materials that go into residential, commercial, and public works projects. Its business is tied to construction activity, repair demand, and large infrastructure programs, which makes it relatively easy to understand: when building activity is healthy, demand for these products tends to be stronger.
Publicly available segment detail for Amrize as a standalone listed company is still limited, so a precise revenue split by product line is not yet fully available in current public materials. What is clear from the company’s financial profile is that revenue is generated mainly from core building materials and related solutions sold into construction markets, with a mix of new-build and repair or renovation exposure. Based on the industry it operates in, the main sources of revenue can be understood as:
- Core building materials: the largest source of revenue, including essential products used in structural and general construction.
- Value-added building solutions: products and systems with higher processing or performance content, typically aimed at improving project efficiency or durability.
- Related services and distribution activities: support functions tied to supplying customers, logistics, and commercial execution.
The broader financial picture shows a business that expanded revenue from about $8.1 billion in 2021 to about $11.8 billion in 2025. Over that period, gross profit and operating income also increased, which suggests the company did not grow only by volume, but also maintained a fairly solid pricing and margin structure. Net income was more uneven from year to year, reflecting the impact of interest expense and other costs below the operating line.
One notable feature is that the business has remained profitable throughout the period shown, with operating income rising from roughly $1.3 billion in 2021 to about $1.9 billion in 2025, even after some moderation from the 2024 peak. That matters for long-term analysis because building materials can be cyclical, so staying meaningfully profitable across changing market conditions is an important sign of resilience.
The operating structure points to a company that has scaled revenue materially since 2021 while keeping gross profit and operating profit at healthy levels. The more recent softening appears to come less from a collapse in sales and more from higher operating and financing costs, which is an important distinction.
Key Figures
| Metric | Value | Sector ⓘ |
|---|---|---|
| Date | Oct 24, 2026 | |
| Context | ||
| Sector | Basic Materials | |
| Industry | Building Materials | |
| Market Cap ⓘ | $21.24B | |
| Beta ⓘ | N/A | |
Value (Cheapness) | ||
| P/E Ratio ⓘ | 17.73 | 16.92 |
| P/B Ratio ⓘ | 1.67 | 1.66 |
| FCF Yield ⓘ | 6.22% | 5.83% |
| Dividend Yield ⓘ | 1.16% | 2.07% |
| EBIT / EV ⓘ | 6.91% | 6.38% |
| PEG ⓘ | 1.04 | |
Growth (Business expansion) | ||
| Revenue Growth ⓘ | 8.60% | 11.25% |
| RPS Growth (5Y CAGR) ⓘ | 9.74% | 4.49% |
| EPS Growth (5Y CAGR) ⓘ | N/A | -15.24% |
| BVPS Growth (5Y CAGR) ⓘ | 17.26% | 5.49% |
| Margin Growth (5Y Trend) ⓘ | 0.27% | -1.54% |
| FCF Growth (5Y CAGR) ⓘ | 6.64% | 0.37% |
| DPS Growth (5Y CAGR) ⓘ | N/A | 5.91% |
Quality (Business durability) | ||
| ROIC (Latest) ⓘ | 7.72% | 9.59% |
| ROA (Latest) ⓘ | 4.95% | 4.92% |
| ROIC (5Y Median) ⓘ | N/A | 7.91% |
| ROA (5Y Median) ⓘ | 4.96% | 3.92% |
| Net Debt / EBIT (Latest) ⓘ | 3.12 | 1.36 |
| Net Debt / EBIT (5Y Median) ⓘ | 3.32 | 1.69 |
| Net Debt / EBITDA (Latest) ⓘ | 2.07 | 0.93 |
| Net Debt / Assets ⓘ | 24.00% | 13.69% |
| EBITDA / Interest ⓘ | 8.55 | 12.38 |
| Operating Margin (Latest) ⓘ | 15.51% | 13.24% |
| Operating Margin (5Y Median) ⓘ | 15.92% | 11.82% |
| Debt to Equity (Latest) ⓘ | 51.59% | 40.30% |
| Profit Margin (Latest) ⓘ | 10.14% | 6.38% |
| Free Cash Flow (Latest) ⓘ | $1.32B | |
Momentum (Price trend) | ||
| 3Y Return ⓘ | N/A | +73.47% |
| 12M Return (excl. last month) ⓘ | -22.49% | +27.59% |
| 6M Return ⓘ | -31.23% | -4.02% |
| Price vs. 200-Day MA ⓘ | -23.60% | -0.65% |
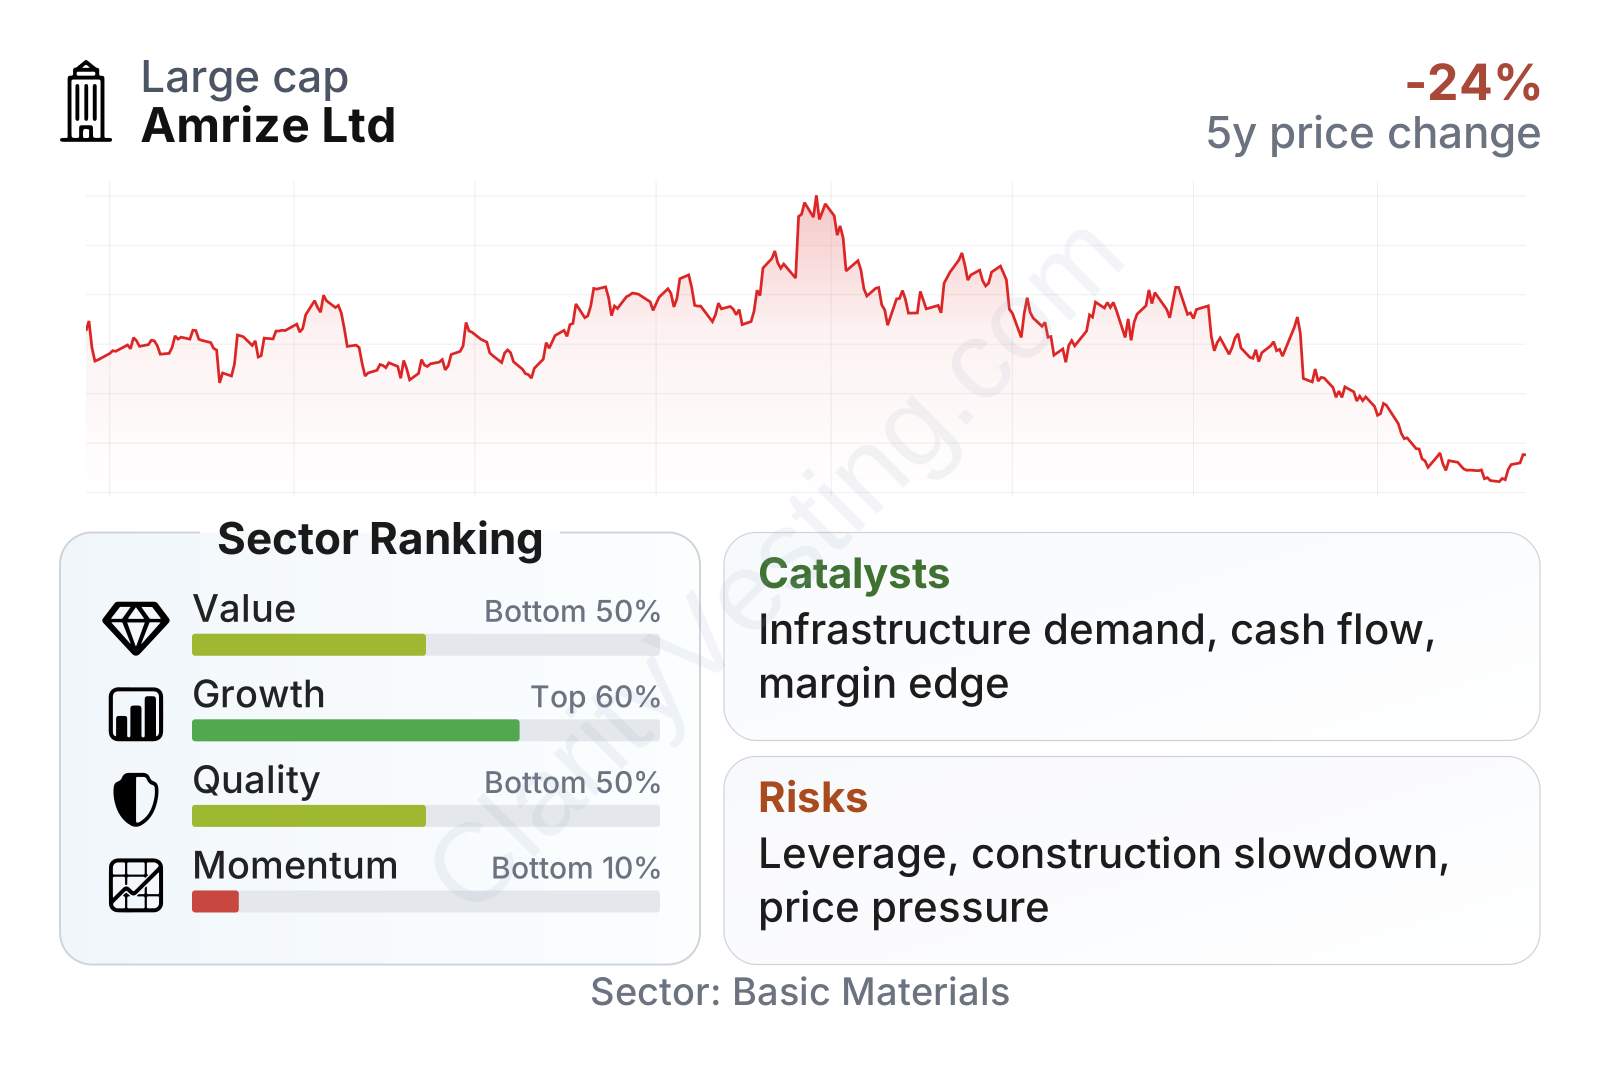
Amrize screens as a mid-to-large company in its sector, with valuation measures sitting close to sector norms rather than at a clear premium. The most notable strengths in the table are cash generation, margin profile, and longer-term compounding in revenue per share, book value per share, and free cash flow. The weaker areas are balance-sheet leverage and stock-price momentum, with recent share performance notably lagging the sector.
The recent stock-price path has been unfavorable. After trading in the low-to-mid $50s for much of the past year, the shares fell to around the high $30s by late September 2026. That decline means the market has become more cautious, even though the underlying business still shows positive revenue growth and solid profitability.
Growth
Amrize operates in a sector with long-term support from housing needs, infrastructure renewal, and repair and remodeling demand. Building materials is not a high-growth industry in the same way as software or biotech, but it can offer durable growth over long periods because buildings, roads, and industrial facilities constantly need new materials, upgrades, and maintenance. That gives the company exposure to a market with recurring real-world demand rather than short-lived trends.
Its growth profile appears credible rather than explosive. Revenue growth was about 4.7% in the first quarter of 2026 and accelerated to about 8.5% by the second quarter. Over five years, revenue per share grew at roughly 9.7% annually, well above the sector median, while free cash flow expanded at roughly 6.6% annually. Those are encouraging signs for a cyclical industrial business because they suggest growth has translated into shareholder value and cash generation over time.
The strategy also makes sense for this type of industry. Companies in building materials usually create value through scale, local distribution networks, pricing discipline, and cost control. Amrize’s operating margin trend over five years is slightly positive, while the sector median trend is negative, which suggests execution has been relatively steady even as conditions changed.
Free cash flow remains a central part of the growth case. Trailing free cash flow is still around $1.3 billion, which is a meaningful level for a company of this size. Strong cash generation gives management room to reduce debt, invest in capacity, pursue targeted acquisitions, or support shareholder returns. In a capital-intensive sector, that flexibility is often more important than headline revenue growth alone.
A near-term catalyst is the gap between business performance and recent stock weakness. If revenue growth remains in the mid-single-digit to high-single-digit range and margins stay healthy, the market could eventually reassess the current level of pessimism. Another possible catalyst is continued infrastructure-related demand in North America and steady nonresidential construction activity, both of which tend to support volume and pricing for building materials suppliers.
Risks
This article is for informational purposes only and does not constitute financial advice. Some content is AI-generated. See Disclaimer


