Stock Analysis · AMP Ltd (AMLTF)
Overview
AMP Ltd is an Australian financial services group focused on wealth management, retirement savings, banking, and related platforms. In simple terms, it helps individuals manage savings and investments, supports financial advisers with investment and administration tools, and also operates a bank. The company has gone through a long restructuring period in recent years, selling non-core operations and narrowing its focus around wealth, platforms, superannuation, and banking.
Its revenue mix can move meaningfully from year to year because investment markets affect fee income, and banking margins depend on interest rates and funding costs. Based on the company’s recent reporting structure and operating profile, AMP’s main economic engines can be summarized as follows:
- Wealth management and platform fees: approximately 45% to 55% of group revenue. This includes administration and investment-related fees earned from superannuation, retirement products, wrap platforms, and managed portfolios.
- Banking income: approximately 25% to 35%. This mainly comes from net interest income on residential mortgages and deposits through AMP Bank.
- Advice, superannuation, and related service income: approximately 10% to 20%. This covers advice-related activities and certain service and product fees tied to retirement and investment clients.
- Other items and market-related income: usually a smaller and more volatile component. This can include investment gains or losses, treasury items, and one-off effects linked to restructuring or asset sales.
The business mix is important for long-term analysis because AMP is no longer trying to be a broad financial conglomerate in every area. It is becoming a more concentrated wealth-and-bank model, which can be easier to understand but also leaves results more exposed to market movements, adviser trends, and mortgage competition.
The operating picture over the last several years suggests a company that has reduced overhead and stabilized profitability after a difficult period, even though revenue has been uneven. Costs appear to have come down more clearly than revenue has improved, which helps explain why profit has remained positive despite modest top-line growth.
A notable pattern is that expenses appear better controlled than they were a few years ago, while profit remains relatively thin compared with the size of the group. That points to a business that has become leaner, but not yet one with a large earnings cushion.
Key Figures
| Metric | Value | Sector ⓘ |
|---|---|---|
| Date | Oct 24, 2026 | |
| Context | ||
| Sector | Financial Services | |
| Industry | Financial Conglomerates | |
| Market Cap ⓘ | $3.12B | |
| Beta ⓘ | 0.31 | |
Value (Cheapness) | ||
| P/E Ratio ⓘ | 26.00 | 12.46 |
| P/B Ratio ⓘ | 0.90 | 1.25 |
| FCF Yield ⓘ | -106.50% | 9.82% |
| Dividend Yield ⓘ | 3.85% | 2.94% |
| EBIT / EV ⓘ | N/A | 8.11% |
| PEG ⓘ | N/A | |
Growth (Business expansion) | ||
| Revenue Growth ⓘ | 2.80% | 9.10% |
| RPS Growth (5Y CAGR) ⓘ | -10.36% | 12.31% |
| EPS Growth (5Y CAGR) ⓘ | N/A | -6.97% |
| BVPS Growth (5Y CAGR) ⓘ | -2.87% | 5.02% |
| Margin Growth (5Y Trend) ⓘ | 101.82% | -4.00% |
| FCF Growth (5Y CAGR) ⓘ | N/A | 4.71% |
| DPS Growth (5Y CAGR) ⓘ | -26.90% | 8.92% |
Quality (Business durability) | ||
| ROIC (Latest) ⓘ | N/A | 9.18% |
| ROE (Latest) ⓘ | 10.03% | 13.93% |
| ROA (Latest) ⓘ | 1.10% | 1.57% |
| ROIC (5Y Median) ⓘ | 2.43% | 7.80% |
| ROE (5Y Median) ⓘ | 3.99% | 12.15% |
| ROA (5Y Median) ⓘ | 0.45% | 1.28% |
| Net Debt / EBIT (Latest) ⓘ | N/A | 1.02 |
| Net Debt / EBIT (5Y Median) ⓘ | 16.92 | 0.72 |
| Net Debt / EBITDA (Latest) ⓘ | 8.40 | 0.88 |
| Operating Margin (Latest) ⓘ | N/A | 22.30% |
| Operating Margin (5Y Median) ⓘ | 79.87% | 24.50% |
| Debt to Equity (Latest) ⓘ | 789.66% | 59.34% |
| Profit Margin (Latest) ⓘ | 6.67% | 26.42% |
| Free Cash Flow (Latest) ⓘ | -$3.33B | |
Momentum (Price trend) | ||
| 3Y Return ⓘ | +79.36% | +95.73% |
| 12M Return (excl. last month) ⓘ | +15.96% | +17.30% |
| 6M Return ⓘ | +30.00% | +6.07% |
| Price vs. 200-Day MA ⓘ | +32.16% | +5.36% |
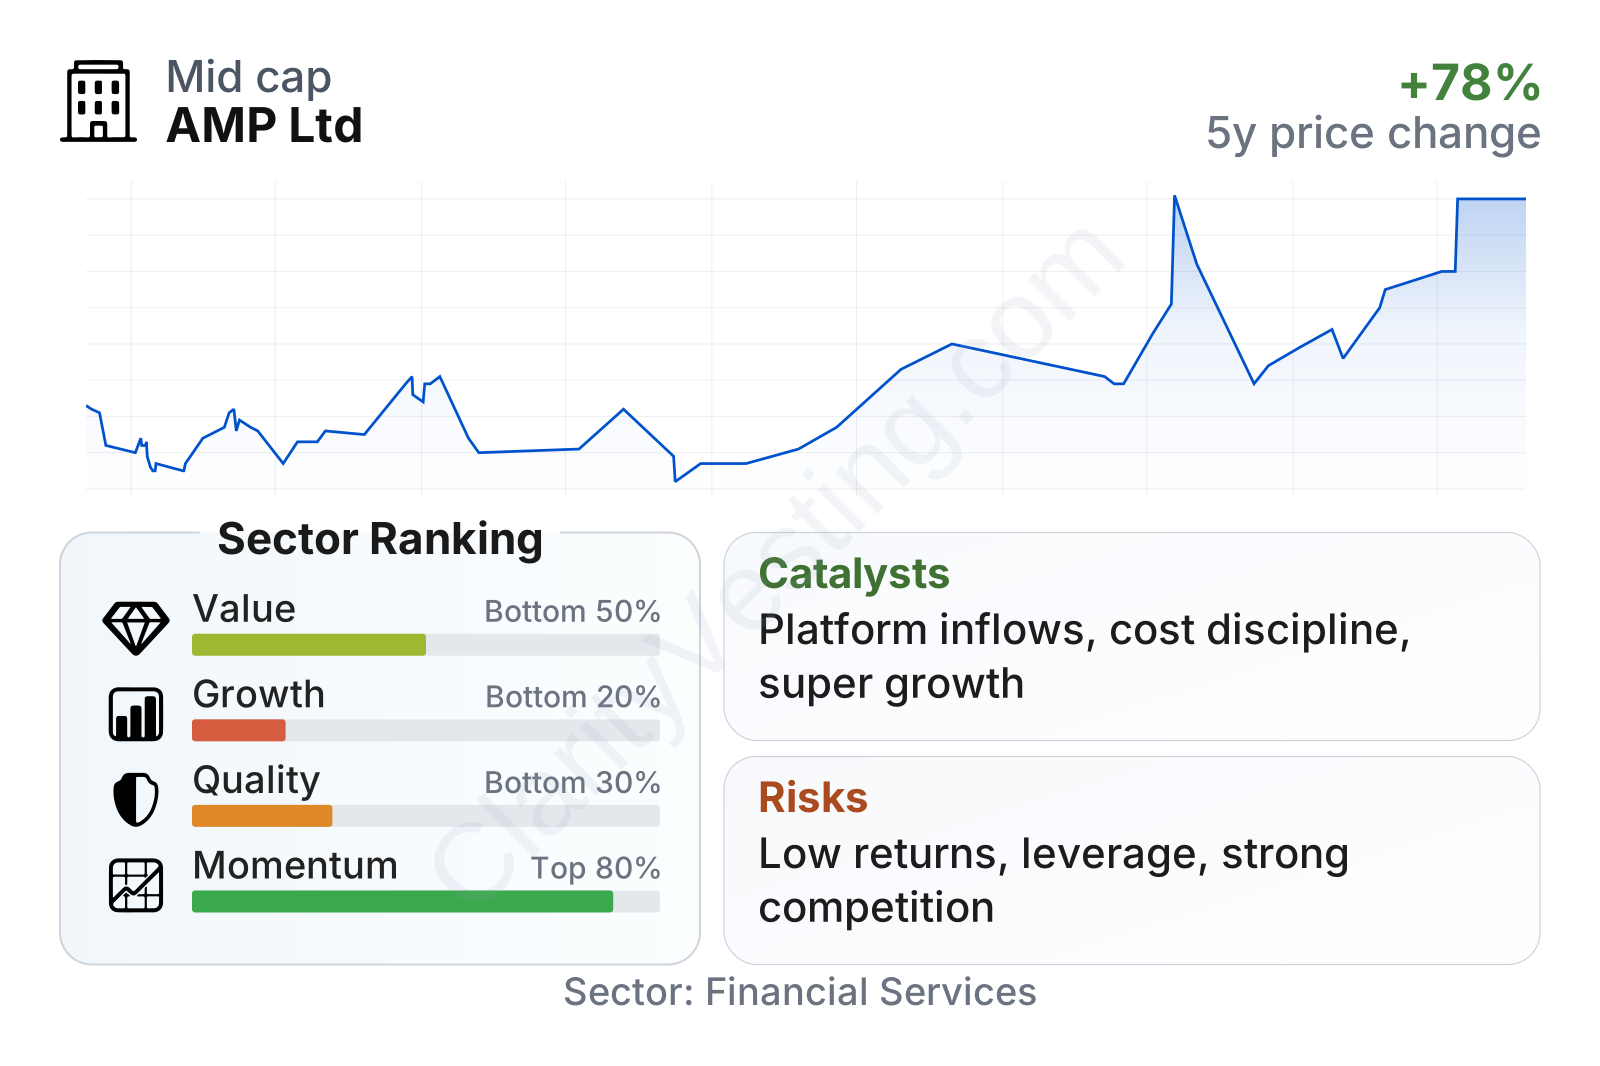
AMP is a mid-sized financial company with a relatively low beta, meaning its share price has historically moved less violently than the broader market. On valuation, the picture is mixed: the earnings multiple is above the sector median, while the price-to-book ratio is below the sector median. That usually means the market is not treating AMP as a high-quality compounder, but it is also not pricing the balance sheet at a premium.
The factor breakdown also shows an unusual combination. Momentum has recently improved, helped by a strong six-month move and a share price well above its long-term average. By contrast, growth and quality still rank weakly against the broader financial sector. Profitability metrics remain below many peers, and free cash flow is currently negative, which limits the case for a simple rerating based only on recent share-price strength.
Growth
AMP operates in segments that have long-term structural support. Retirement savings, pensions, and wealth administration are tied to aging populations and the ongoing need for individuals to manage long-term savings. In Australia, compulsory superannuation remains an especially important backdrop because it creates a large and recurring pool of retirement assets that financial platforms and wealth managers can serve. That gives AMP exposure to a sector with durable demand, even if competition is intense.
The strategic logic is fairly clear. AMP has been simplifying the group, reducing complexity, and concentrating on businesses where scale and recurring client assets matter. That makes sense because platform and retirement businesses can become more attractive when asset balances rise, markets recover, and administration costs are spread across a larger base. The banking arm can also support the group by adding a second source of earnings, although that comes with its own cyclical pressures.
Recent earnings progression points to improvement, but not a breakout. Earnings per share have edged up from late 2024 into mid-2025, suggesting that the restructuring work has at least translated into steadier profitability.
Book value per share has also recovered from the sharper decline seen earlier in the decade, though it still does not show the kind of steady compounding associated with stronger franchises in financial services.
One of the more credible catalysts is operating leverage. If net cash flows into platforms and retirement products improve, and if markets remain supportive, a relatively small increase in revenue can have a noticeable impact on earnings because AMP has already been working on its cost base. Another potential catalyst is further strategic action around capital management, partnerships, or business optimization, especially since AMP has spent years reshaping its portfolio.
Recent company updates have continued to emphasize simplification, capital discipline, and the performance of core wealth and banking operations. For long-term observers, the main opportunity is not tied to a single breakthrough product. It is tied to whether AMP can turn a more focused structure into sustainably better returns, steadier net inflows, and more consistent earnings growth than it has delivered over the last five years.
Risks
This article is for informational purposes only and does not constitute financial advice. Some content is AI-generated. See Disclaimer


