Stock Analysis · A.P. Møller - Mærsk A/S (AMKBF)
Overview
A.P. Møller - Mærsk A/S is one of the world’s best-known shipping and logistics groups. The company started as an ocean carrier, but over time it has expanded into a broader transport network that aims to move goods from factory floors to final destinations. That includes container shipping, port terminals, inland transportation, warehousing, customs services, and logistics support for large global supply chains.
For a long-term view, the key point is that Maersk is no longer only a container shipping company. Management has been trying to build an integrated logistics platform around its global maritime network. This matters because pure container shipping is highly cyclical, while logistics and terminals can add steadier and more diversified earnings over time.
Based on the company’s recent annual reporting structure, revenue is mainly generated from the following areas:
- Ocean: approximately 65% to 75% of revenue. This is the core container shipping business, including freight transport on Maersk’s vessel network.
- Logistics & Services: approximately 20% to 30% of revenue. This includes warehousing, distribution, trucking, air freight, customs handling, fulfillment, and supply-chain management services.
- Terminals: approximately 10% to 15% of revenue. This comes from APM Terminals, which operates port terminals and related infrastructure.
- Towage & Maritime Services and other activities: a small share of revenue after portfolio changes and divestments, depending on the reporting period.
This mix shows a company still dominated by ocean freight, but with a meaningful and strategically important contribution from logistics and terminals. The broader platform gives Maersk more touchpoints with customers than a traditional shipping line and helps it capture revenue beyond the sea leg of transport.
The multi-year profit flow also shows how strongly earnings rose during the pandemic-era shipping boom and then normalized. Revenue stayed large, but margins moved sharply lower after 2022 as freight rates cooled, reminding readers that scale does not eliminate the industry cycle.
Key Figures
| Metric | Value | Sector ⓘ |
|---|---|---|
| Date | Oct 03, 2026 | |
| Context | ||
| Sector | Industrials | |
| Industry | Marine Shipping | |
| Market Cap ⓘ | $51.13B | |
| Beta ⓘ | 0.55 | |
Value (Cheapness) | ||
| P/E Ratio ⓘ | 22.78 | 22.45 |
| P/B Ratio ⓘ | 0.96 | 1.98 |
| FCF Yield ⓘ | 10.14% | 6.31% |
| Dividend Yield ⓘ | 2.08% | 1.96% |
| EBIT / EV ⓘ | 5.22% | 4.81% |
| PEG ⓘ | 0.38 | |
Growth (Business expansion) | ||
| Revenue Growth ⓘ | 20.00% | 9.10% |
| RPS Growth (5Y CAGR) ⓘ | 2.28% | 7.75% |
| EPS Growth (5Y CAGR) ⓘ | -55.94% | -13.59% |
| BVPS Growth (5Y CAGR) ⓘ | 11.27% | 6.22% |
| Margin Growth (5Y Trend) ⓘ | -25.14% | 0.72% |
| FCF Growth (5Y CAGR) ⓘ | -24.06% | 10.98% |
| DPS Growth (5Y CAGR) ⓘ | 34.32% | 9.48% |
Quality (Business durability) | ||
| ROIC (Latest) ⓘ | 3.95% | 10.92% |
| ROA (Latest) ⓘ | 2.57% | 5.41% |
| ROIC (5Y Median) ⓘ | 9.87% | 9.21% |
| ROA (5Y Median) ⓘ | 7.18% | 4.94% |
| Net Debt / EBIT (Latest) ⓘ | 3.54 | 2.07 |
| Net Debt / EBIT (5Y Median) ⓘ | 1.52 | 2.28 |
| Net Debt / EBITDA (Latest) ⓘ | 1.16 | 1.43 |
| Net Debt / Assets ⓘ | 12.71% | 19.27% |
| EBITDA / Interest ⓘ | 4.82 | 9.53 |
| Operating Margin (Latest) ⓘ | 5.59% | 10.50% |
| Operating Margin (5Y Median) ⓘ | 11.71% | 10.27% |
| Debt to Equity (Latest) ⓘ | 31.63% | 65.48% |
| Profit Margin (Latest) ⓘ | 4.07% | 6.62% |
| Free Cash Flow (Latest) ⓘ | $5.18B | |
Momentum (Price trend) | ||
| 3Y Return ⓘ | +146.82% | +58.56% |
| 12M Return (excl. last month) ⓘ | +68.64% | +15.63% |
| 6M Return ⓘ | +38.37% | +4.19% |
| Price vs. 200-Day MA ⓘ | +40.24% | +0.93% |
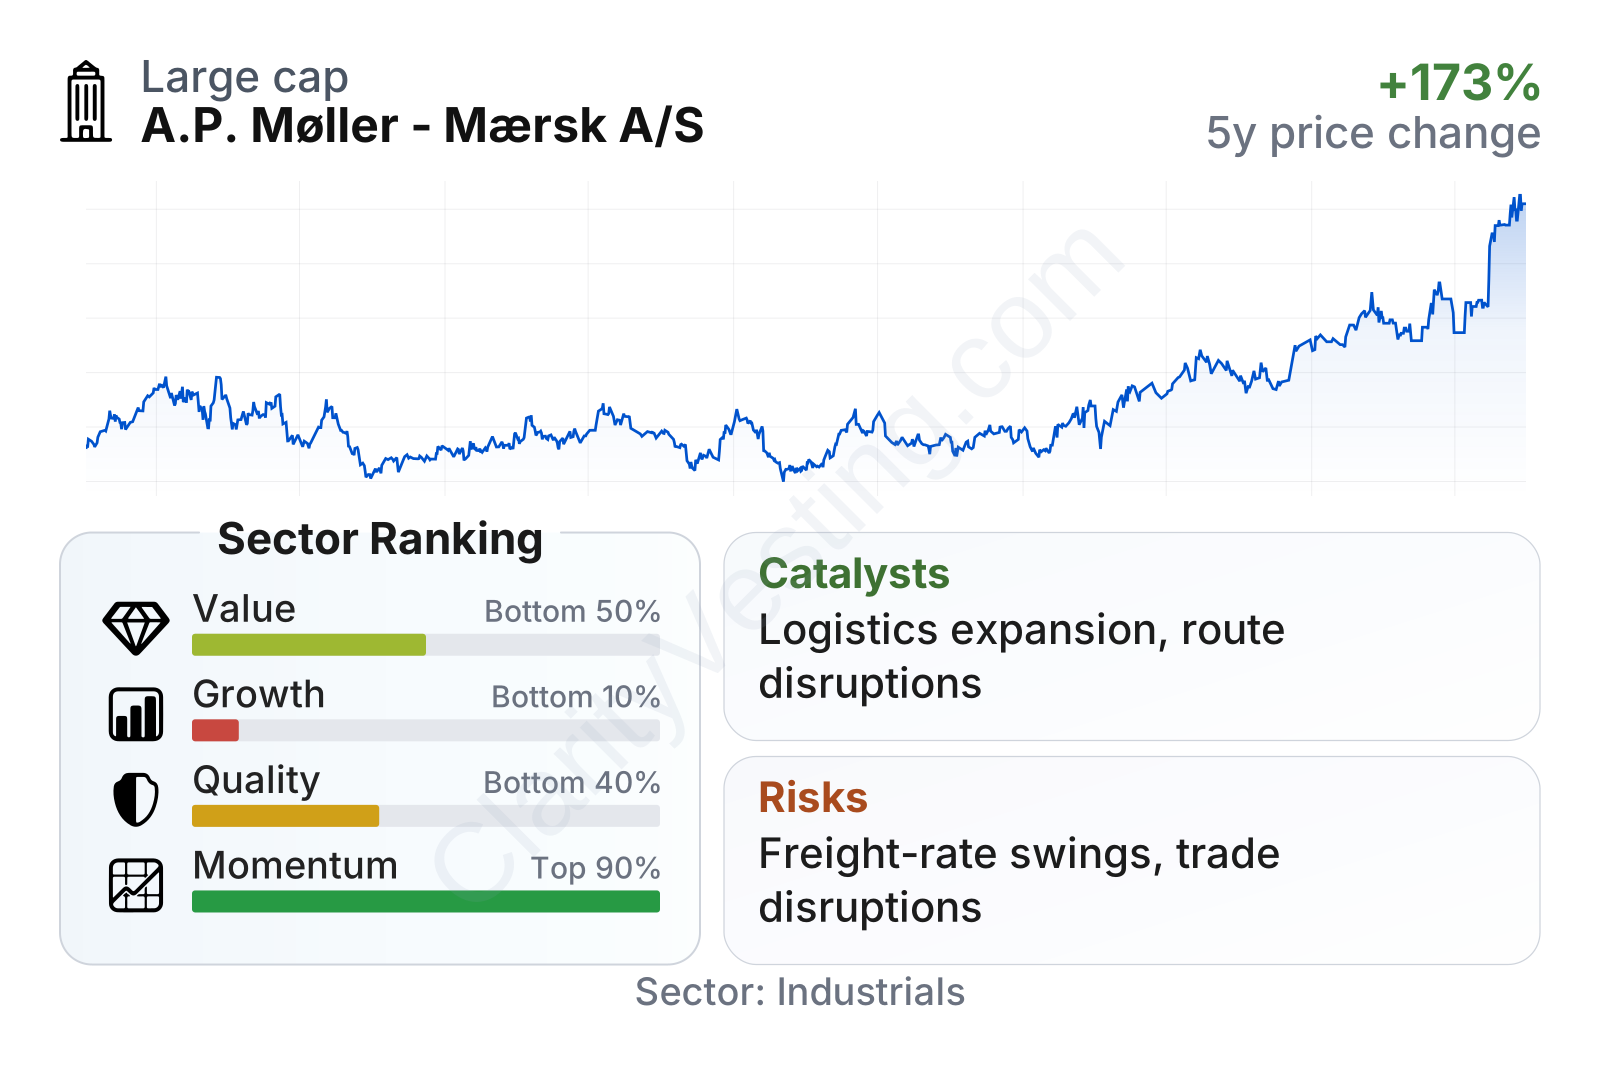
Maersk is a very large global transport company with a comparatively low share-price volatility profile, reflected in a beta well below 1. On valuation, it looks mixed rather than uniformly cheap or expensive: the earnings multiple sits close to the sector median, while the price-to-book ratio is below the sector median and free cash flow yield is stronger than average. That combination often points to a company the market still treats with caution because of cyclical exposure, even when cash generation remains meaningful.
The factor profile is uneven. Value and momentum look solid, but growth and current profitability metrics are weaker relative to much of the industrial sector. In simple terms, the market has rewarded the recent recovery in shipping conditions, yet the business has not fully rebuilt the exceptional earnings power seen during the 2021-2022 peak.
Growth
Maersk operates in global trade and logistics, which is a large and structurally important sector, but not one that grows in a straight line. Over the long run, demand tends to follow world trade volumes, supply-chain complexity, e-commerce flows, and the need for resilient sourcing networks. Those are supportive drivers. At the same time, shipping remains one of the most cyclical industries in the market because freight rates can rise or fall quickly when vessel supply and cargo demand move out of balance.
Its strategy broadly makes sense for future growth because it tries to reduce dependence on spot freight pricing alone. By connecting ocean transport with terminals, warehousing, inland transport, and supply-chain services, Maersk can deepen customer relationships and potentially earn a larger share of each shipment’s total value. This also fits a real customer need: large importers and exporters increasingly want fewer vendors and more end-to-end visibility.
Revenue growth has been volatile, which is typical for a shipping-centered business. After the extraordinary surge in 2021 and early 2022, revenue contracted sharply as freight conditions normalized, then returned to growth in parts of 2024 and again more recently. The latest year-over-year pace is positive and above the broader sector median, but the longer five-year growth picture is still weak because it is being measured against a boom-and-correction cycle rather than a smooth expansion path.
Cash generation tells a similar story. Free cash flow remains positive and substantial in absolute terms, but it is far below the exceptional highs reached during the shipping boom. That is still important: even after normalization, Maersk continues to produce billions of dollars in free cash flow, which supports fleet renewal, logistics investment, balance-sheet flexibility, and shareholder distributions when management chooses to make them.
One notable catalyst is the company’s continued push into integrated logistics and contract-based services, where customer relationships can be longer and less exposed to day-to-day freight-rate swings. Another is infrastructure and network optimization, including terminal assets and inland logistics links that can improve service quality and lock in cargo flows. Recent industry disruptions in global shipping routes have also shown that large operators with established networks can sometimes benefit from higher rates and tighter capacity, even if those same disruptions also increase complexity and costs.
Risks
This article is for informational purposes only and does not constitute financial advice. Some content is AI-generated. See Disclaimer


