Stock Analysis · AP Moeller - Maersk A/S A (AMKAF)
Overview
AP Moller - Maersk is one of the world’s largest shipping and logistics groups. The company is best known for moving containers by sea, but its business is broader than that. Maersk combines ocean shipping, port terminals, inland transport, warehousing, customs services, and supply chain management. The goal is to serve customers from factory floor to final delivery rather than only selling space on ships.
This matters because Maersk is no longer just a freight-rate business. It still depends heavily on container shipping, but management has spent several years building a more integrated logistics platform. That gives the company more touchpoints with customers and can reduce reliance on any single transport step, even though ocean freight remains the main earnings driver.
Based on Maersk’s recent reporting structure, revenue is mainly generated from the following activities:
- Ocean: approximately 65% to 70% of revenue in recent years. This includes container shipping services, freight rates, bunker-related charges, and network services tied to global ocean transport.
- Logistics & Services: approximately 20% to 25% of revenue. This includes warehousing, distribution, trucking, air freight, customs handling, and end-to-end supply chain solutions.
- Terminals: approximately 8% to 12% of revenue. This comes from APM Terminals, which operates port terminals and inland depots and earns from container handling and related services.
- Towage & Maritime Services and other activities: usually a small low-single-digit share after Maersk’s portfolio reshaping, including maritime support services and smaller residual activities.
That mix shows a company still centered on global trade flows, but with a deliberate push into steadier logistics and infrastructure businesses. The broad pattern in recent years has been a post-pandemic normalization: revenue and profits surged in 2021 and 2022, dropped sharply in 2023 as freight rates normalized, recovered in 2024, and then softened again in 2025 as margins came under pressure.
The financial flow over the last several years shows how cyclical Maersk can be. Revenue peaked in 2022, then fell back sharply in 2023 before stabilizing. Profitability compressed much faster than revenue, which is typical for shipping when freight rates cool. Even so, the company remained profitable and cash generative, which reflects the benefits of scale, cost discipline, and a broader logistics footprint.
Key Figures
| Metric | Value | Sector ⓘ |
|---|---|---|
| Date | Oct 24, 2026 | |
| Context | ||
| Sector | Industrials | |
| Industry | Marine Shipping | |
| Market Cap ⓘ | $50.37B | |
| Beta ⓘ | 0.51 | |
Value (Cheapness) | ||
| P/E Ratio ⓘ | 22.44 | 22.29 |
| P/B Ratio ⓘ | 0.93 | 1.98 |
| FCF Yield ⓘ | 9.98% | 6.26% |
| Dividend Yield ⓘ | 2.16% | 1.92% |
| EBIT / EV ⓘ | 5.29% | 4.83% |
| PEG ⓘ | 0.36 | |
Growth (Business expansion) | ||
| Revenue Growth ⓘ | 20.00% | 9.30% |
| RPS Growth (5Y CAGR) ⓘ | 2.28% | 7.76% |
| EPS Growth (5Y CAGR) ⓘ | -55.94% | -13.17% |
| BVPS Growth (5Y CAGR) ⓘ | 11.27% | 6.13% |
| Margin Growth (5Y Trend) ⓘ | -25.14% | 0.74% |
| FCF Growth (5Y CAGR) ⓘ | -24.06% | 10.79% |
| DPS Growth (5Y CAGR) ⓘ | 34.32% | 9.41% |
Quality (Business durability) | ||
| ROIC (Latest) ⓘ | 3.99% | 10.75% |
| ROA (Latest) ⓘ | 2.60% | 5.41% |
| ROIC (5Y Median) ⓘ | 9.87% | 9.37% |
| ROA (5Y Median) ⓘ | 7.18% | 4.95% |
| Net Debt / EBIT (Latest) ⓘ | 3.52 | 2.04 |
| Net Debt / EBIT (5Y Median) ⓘ | 1.52 | 2.27 |
| Net Debt / EBITDA (Latest) ⓘ | 1.15 | 1.39 |
| Net Debt / Assets ⓘ | 12.71% | 19.27% |
| EBITDA / Interest ⓘ | N/A | 9.58 |
| Operating Margin (Latest) ⓘ | 5.64% | 10.49% |
| Operating Margin (5Y Median) ⓘ | 11.71% | 10.30% |
| Debt to Equity (Latest) ⓘ | 31.63% | 64.82% |
| Profit Margin (Latest) ⓘ | 4.07% | 6.67% |
| Free Cash Flow (Latest) ⓘ | $5.03B | |
Momentum (Price trend) | ||
| 3Y Return ⓘ | +165.92% | +67.77% |
| 12M Return (excl. last month) ⓘ | +76.77% | +12.05% |
| 6M Return ⓘ | +43.24% | 0.00% |
| Price vs. 200-Day MA ⓘ | +32.84% | +0.67% |
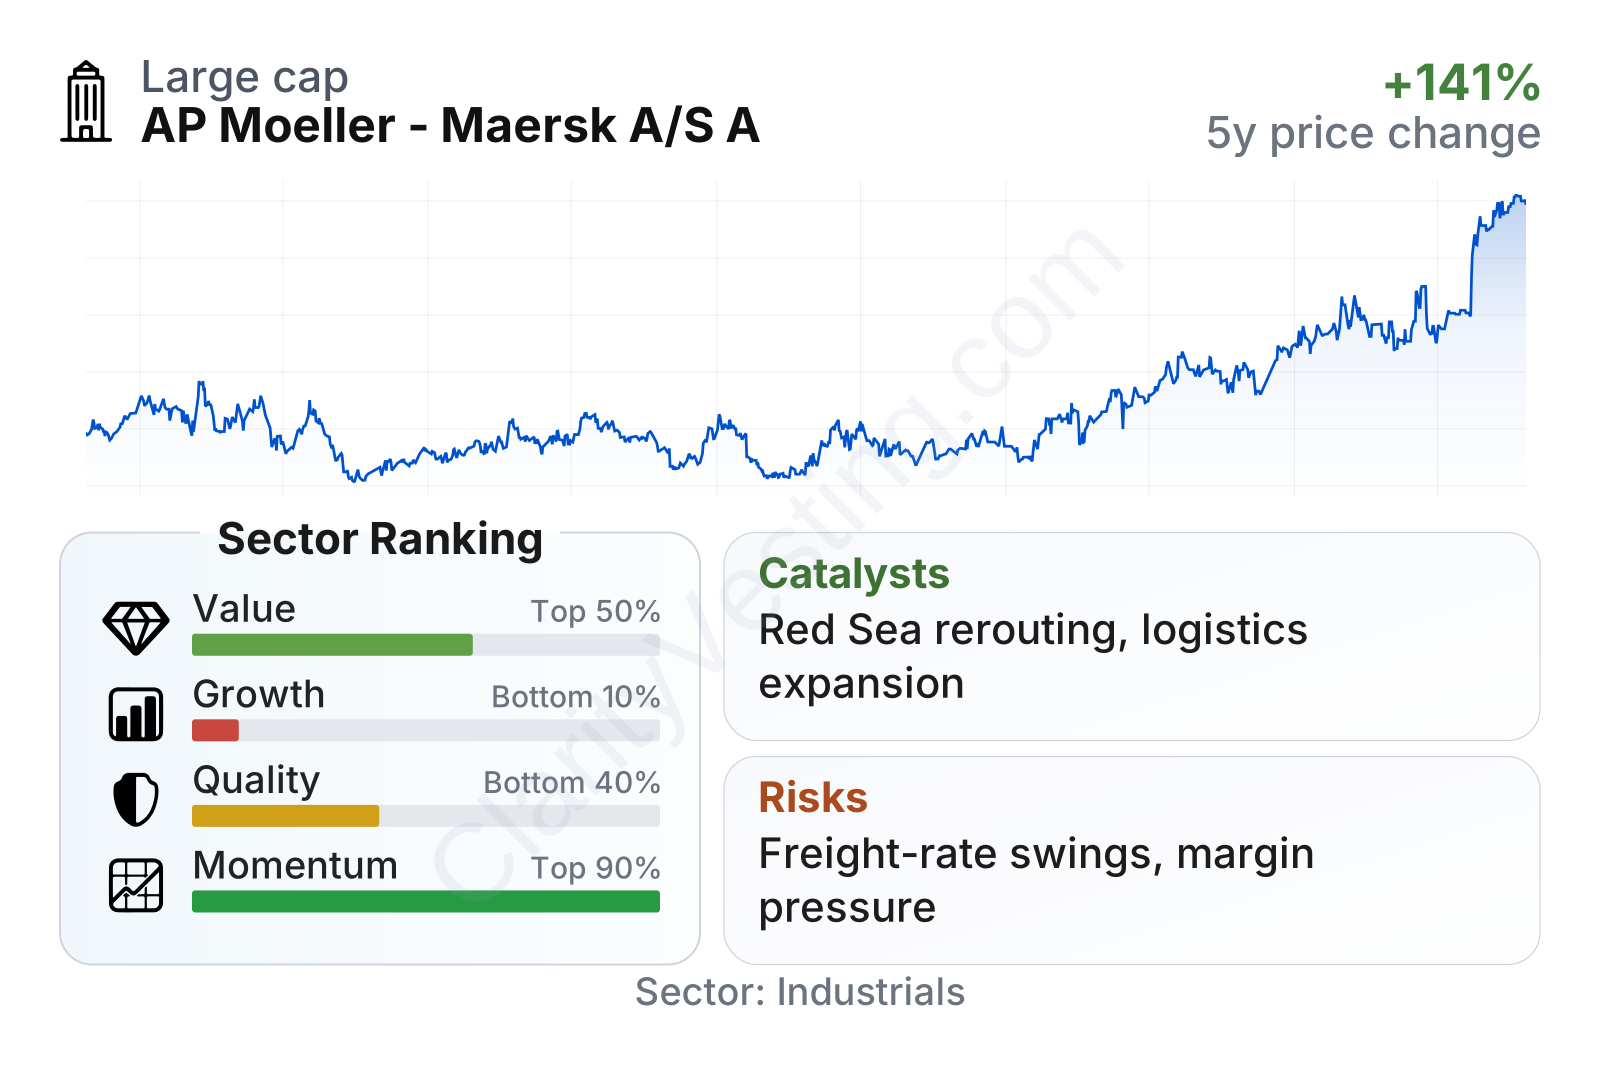
Maersk currently looks mixed on a factor basis. Valuation measures are generally favorable versus the industrial sector median, helped by a price-to-book ratio below 1 and a free cash flow yield above the sector median. Balance sheet leverage is moderate, with debt to equity around 32%, clearly below the sector median. The weaker area is growth and current profitability: recent returns on capital, operating margin, and profit margin sit below sector norms, which reflects the difficult earnings reset after the shipping boom. Price momentum, however, has been notably strong over the last year and over three years.
In size terms, Maersk remains a very large global industrial company. Its beta has been relatively low, which suggests the shares have been less volatile than the broader market, although the underlying business itself remains highly cyclical because freight pricing can move dramatically.
Growth
Maersk operates in a sector with long-term relevance rather than one with smooth, automatic expansion. Global shipping and logistics grow over time with trade, industrial production, e-commerce, and supply chain complexity, but yearly performance can be highly uneven. This is not a classic high-growth industry; it is a strategic backbone industry where scale, network density, and customer relationships matter more than rapid disruption.
Maersk’s growth strategy is logical for that environment. Instead of relying only on container shipping, it has been trying to build an integrated logistics model that combines ocean transport with landside services, warehousing, and terminals. That strategy makes sense because large customers increasingly want fewer providers, better visibility, and coordinated transport across regions. It also gives Maersk a chance to capture a larger share of each customer’s supply chain spending.
Recent revenue growth has been volatile. The company moved from exceptional expansion during the freight boom to a deep contraction in 2023, then back to positive growth, with the latest year-over-year reading around 20%. That rebound looks strong in isolation, but the longer pattern still points to a normalization business rather than a straight-line growth profile. Over five years, revenue per share growth has been modest compared with the broader industrial sector.
Cash generation tells a similar story. Free cash flow was extraordinarily strong during the peak shipping years and then normalized sharply. The current level remains positive and sizeable in absolute terms, which is important because it supports fleet investment, logistics expansion, and shareholder distributions. Still, the trend confirms that Maersk’s cash profile is tied closely to freight market conditions.
Several catalysts could matter over the next few years. Continued supply chain redesign by multinational customers may support demand for integrated logistics services. Port infrastructure and contract logistics can also provide steadier revenue than ocean freight alone. Another important driver is disruption in global shipping lanes, especially rerouting around the Red Sea and Suez area, which has at times tightened effective vessel supply and supported freight rates. In addition, Maersk has been investing in lower-emission shipping, including methanol-enabled vessels, which could strengthen its position with customers under pressure to decarbonize supply chains.
Recent company updates have also highlighted a more disciplined capital allocation approach after the windfall years. That matters because the shipping cycle can punish companies that overexpand when markets are strong. For Maersk, future growth quality may depend less on headline volume growth and more on whether the company can protect margins while expanding logistics and keeping shipping capacity under control.
Risks
This article is for informational purposes only and does not constitute financial advice. Some content is AI-generated. See Disclaimer