Stock Analysis · Admiral Group plc (AMIGF)
Overview
Admiral Group plc is a U.K.-based insurance company best known for car insurance. It focuses on personal lines coverage, meaning products sold to individuals rather than large businesses. The group started in motor insurance and still earns most of its money there, but it also sells household, travel, pet, and van insurance, and it has businesses that provide loans and other insurance-related services. Geographically, the U.K. remains the core market, with additional operations in continental Europe and the United States.
The business model is relatively easy to understand. Admiral writes insurance policies, earns premiums from customers, and then pays claims and operating costs. A notable feature is that it also earns meaningful income from add-on products, commissions, and profit-sharing arrangements linked to reinsurance. That can make reported revenue look different from a more traditional insurer, so profit trends and underwriting discipline matter more than revenue alone.
Based on recent annual reporting, the main sources of revenue and earnings are still centered on U.K. motor insurance, with the rest spread across other insurance lines and international operations.
- U.K. motor insurance: approximately 70% to 80% of group insurance turnover and the clear main profit engine. This includes private car coverage sold mainly under the Admiral brand and related brands.
- International insurance operations: approximately 10% to 20%. This includes motor and other personal insurance activities in markets such as Spain, Italy, France, and the U.S.
- Household and other personal insurance: approximately 5% to 10%. This includes home, pet, travel, and van-related products.
- Admiral Money and other services: less than 10%. This includes consumer lending and certain ancillary or fee-based activities.
Over the last several years, the group has expanded revenue strongly while profitability has been more cyclical, reflecting changing claims inflation, pricing conditions, and reserve movements. More recently, earnings have recovered as premium increases worked through the book and underwriting conditions improved.
The long-term pattern shows a business that has materially increased revenue since 2021, while net income was hit hard during the inflation-driven pressure period and then rebounded. Operating income and net income both improved sharply into 2024 and 2025, suggesting that pricing actions and better claims experience have been feeding through, even though the path has not been smooth.
Key Figures
| Metric | Value | Sector ⓘ |
|---|---|---|
| Date | Oct 03, 2026 | |
| Context | ||
| Sector | Financial Services | |
| Industry | Insurance - Property & Casualty | |
| Market Cap ⓘ | $15.84B | |
| Beta ⓘ | 0.20 | |
Value (Cheapness) | ||
| P/E Ratio ⓘ | 18.40 | 12.60 |
| P/B Ratio ⓘ | 14.33 | 1.23 |
| FCF Yield ⓘ | 3.46% | 10.16% |
| Dividend Yield ⓘ | 3.64% | 2.96% |
| EBIT / EV ⓘ | N/A | 7.77% |
| PEG ⓘ | 2.53 | |
Growth (Business expansion) | ||
| Revenue Growth ⓘ | N/A | 9.50% |
| RPS Growth (5Y CAGR) ⓘ | 26.93% | 12.10% |
| EPS Growth (5Y CAGR) ⓘ | -15.89% | -9.45% |
| BVPS Growth (5Y CAGR) ⓘ | -7.26% | 5.01% |
| Margin Growth (5Y Trend) ⓘ | -28.32% | -4.07% |
| FCF Growth (5Y CAGR) ⓘ | 38.87% | 4.96% |
| DPS Growth (5Y CAGR) ⓘ | -8.03% | 8.79% |
Quality (Business durability) | ||
| ROIC (Latest) ⓘ | 56.83% | 9.60% |
| ROE (Latest) ⓘ | 90.29% | 13.84% |
| ROA (Latest) ⓘ | 14.98% | 1.53% |
| ROIC (5Y Median) ⓘ | 27.26% | 7.86% |
| ROE (5Y Median) ⓘ | 52.80% | 12.20% |
| ROA (5Y Median) ⓘ | 8.75% | 1.29% |
| Net Debt / EBIT (Latest) ⓘ | 0.78 | 0.91 |
| Net Debt / EBIT (5Y Median) ⓘ | 1.53 | 0.74 |
| Net Debt / EBITDA (Latest) ⓘ | 0.72 | 0.97 |
| Operating Margin (Latest) ⓘ | 24.17% | 22.12% |
| Operating Margin (5Y Median) ⓘ | 18.02% | 24.39% |
| Debt to Equity (Latest) ⓘ | 138.88% | 60.37% |
| Profit Margin (Latest) ⓘ | 13.36% | 26.62% |
| Free Cash Flow (Latest) ⓘ | $548.85M | |
Momentum (Price trend) | ||
| 3Y Return ⓘ | +109.64% | +89.23% |
| 12M Return (excl. last month) ⓘ | +24.46% | +17.35% |
| 6M Return ⓘ | +30.36% | +10.00% |
| Price vs. 200-Day MA ⓘ | +57.74% | +3.73% |
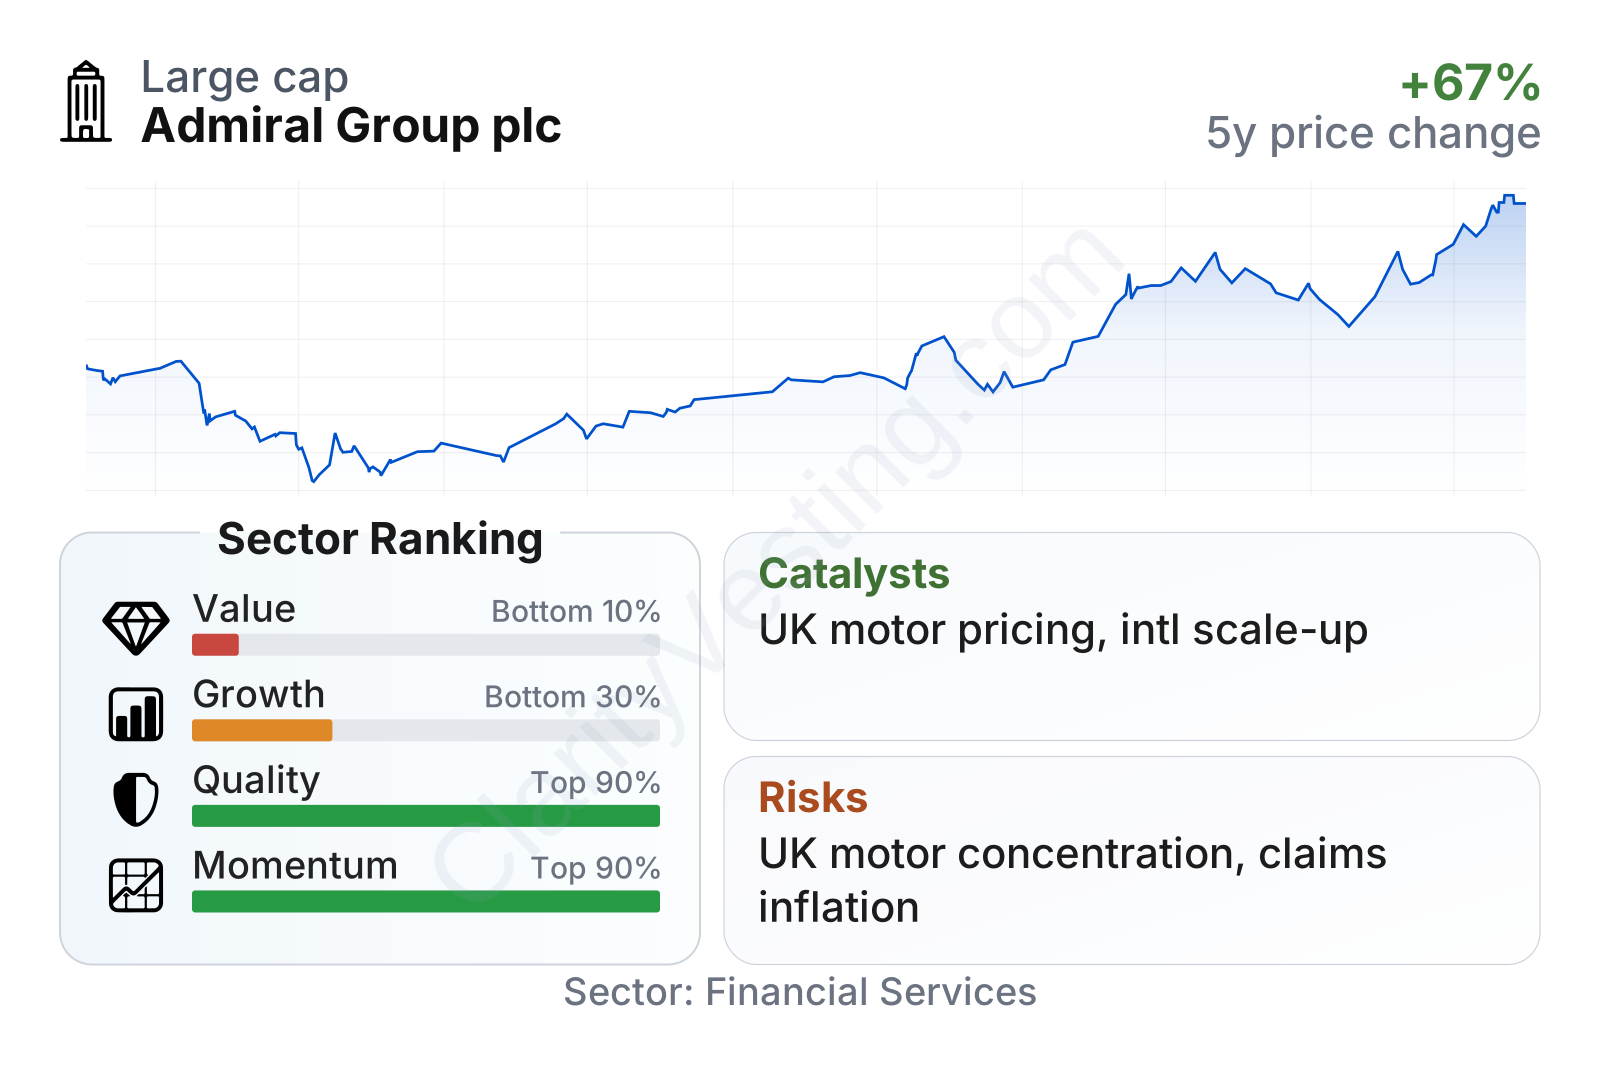
Admiral stands out for profitability and efficiency more than for cheapness. On quality measures, it ranks near the top of its sector, with very strong returns on capital, equity, and assets versus peers. Momentum is also strong, reflecting a share price recovery over the last few years. The weaker areas are valuation and recent growth ranking: the stock trades above sector medians on earnings and far above them on book value, while recent year-over-year revenue growth looks muted. That combination points to a company the market already recognizes as high quality, leaving less room for valuation mistakes.
In size, Admiral is a large insurer but not one of the global giants. Its beta is low, which suggests the shares have historically moved less than the broader market. The dividend yield is above the sector median, but the company’s dividend has not followed a straight upward line over the last five years, which matters for readers focused on payout consistency.
Growth
Admiral operates in a sector that is mature but still structurally relevant. Motor insurance is not a fast-growth industry in the way software or semiconductors can be, yet it benefits from recurring demand because drivers need coverage every year. Growth usually comes from pricing, market share gains, product expansion, and geographic reach rather than from entirely new categories. That makes execution, brand strength, data pricing, and expense control especially important.
Admiral’s strategy is sensible for that kind of market. It has a strong direct-to-consumer position in U.K. motor insurance, a well-known brand, and a history of disciplined underwriting. It also uses reinsurance extensively, which can reduce volatility and capital strain, allowing the company to keep expanding without carrying all the risk on its own balance sheet. Beyond motor, management has been building household, pet, travel, and lending activities, giving the group more ways to deepen customer relationships.
Even without a visible long-term earnings chart here, the broader pattern matters: earnings were pressured by claims inflation and then recovered as higher premiums and improved margins came through. That rebound is important because insurers often need time for pricing actions to show up in reported profit.
Book value per share has been uneven rather than steadily compounding. It declined sharply after 2021, recovered in 2024, and then moved lower again in 2025. For an insurer, that suggests the path of capital generation has been influenced by payout policy, reserve movements, and underwriting cycles rather than by smooth accumulation of equity. It does not cancel out the business strengths, but it does help explain why the market tends to value Admiral on earnings power and franchise quality rather than on simple balance-sheet growth.
A meaningful catalyst is the continued normalization of motor insurance pricing after a period of unusually high claims inflation in the U.K. If claims trends remain manageable while premiums stay elevated, underwriting margins can remain strong. Another opportunity comes from international operations: they are smaller today, but successful scaling in Europe or better performance in the U.S. would widen Admiral’s profit base beyond the U.K. core. Recent company communications have also pointed to continued customer growth and stronger insurance results, which supports the view that the recovery phase is not based on a one-off event alone.
Risks
This article is for informational purposes only and does not constitute financial advice. Some content is AI-generated. See Disclaimer