Stock Analysis · Alamar Biosciences Inc (ALMR)
Overview
Alamar Biosciences is a life science tools company focused on ultra-sensitive protein detection. In simple terms, it develops instruments, consumables, and software that help researchers and drug developers measure very small amounts of proteins in blood and other samples. This kind of testing is increasingly important in areas such as early disease detection, precision medicine, and monitoring how patients respond to treatment. The company’s flagship platform, NULISA, is designed to improve sensitivity and reduce background noise compared with older protein analysis methods.
Alamar operates in the proteomics market, a part of healthcare and biotechnology that is attracting attention because drug companies and academic labs want better biomarker tools. The business model is similar to many life science tools companies: sell or place instruments, then generate repeat revenue from consumables, assays, and related services as customers continue to use the installed base.
Based on company disclosures, revenue is primarily tied to its proteomics platform and associated products and services. Public filings do not always break every category into exact percentages, but the main sources can be summarized as follows:
- Product revenue: the largest source, likely the clear majority of total revenue in 2025. This includes instruments, assay kits, reagents, and other consumables used on the NULISA platform.
- Service and other revenue: a smaller contribution, likely a minority of total revenue. This generally includes laboratory services, collaborations, and support-related activity tied to customer use of the platform.
The broad revenue mix matters because recurring consumables and assay sales are usually more attractive than one-time instrument sales. As the installed base grows, the company’s long-term economics could become more durable if customers continue running samples regularly.
The company’s financial flow shows a business moving from an early commercial stage toward scale. Revenue expanded sharply from 2024 to 2025, gross profit improved substantially, and losses narrowed, although spending on commercialization and product development remained very high. Research and development still absorbs a large share of resources, which fits a company that is trying to establish a technology platform rather than maximize near-term earnings.
A notable improvement is that revenue in 2025 rose to a level close to total operating expenses, a large step up from 2024 when expenses far exceeded sales. The business is still loss-making, but the gap has narrowed as gross profit expanded and interest expense fell.
Key Figures
| Metric | Value | Sector ⓘ |
|---|---|---|
| Date | Oct 03, 2026 | |
| Context | ||
| Sector | Healthcare | |
| Industry | Medical Devices | |
| Market Cap ⓘ | $2.36B | |
| Beta ⓘ | N/A | |
Value (Cheapness) | ||
| P/E Ratio ⓘ | N/A | 24.06 |
| P/B Ratio ⓘ | 6.09 | 3.08 |
| FCF Yield ⓘ | -2.66% | 3.07% |
| Dividend Yield ⓘ | N/A | 2.05% |
| EBIT / EV ⓘ | -2.41% | 0.63% |
| PEG ⓘ | N/A | |
Growth (Business expansion) | ||
| Revenue Growth ⓘ | 82.10% | 7.50% |
| RPS Growth (5Y CAGR) ⓘ | N/A | 8.70% |
| EPS Growth (5Y CAGR) ⓘ | N/A | -18.20% |
| BVPS Growth (5Y CAGR) ⓘ | N/A | 3.95% |
| Margin Growth (5Y Trend) ⓘ | N/A | -0.58% |
| FCF Growth (5Y CAGR) ⓘ | N/A | 0.88% |
| DPS Growth (5Y CAGR) ⓘ | N/A | 6.80% |
Quality (Business durability) | ||
| ROIC (Latest) ⓘ | N/A | 3.29% |
| ROA (Latest) ⓘ | N/A | 3.02% |
| ROIC (5Y Median) ⓘ | N/A | 4.75% |
| ROA (5Y Median) ⓘ | N/A | 1.93% |
| Net Debt / EBIT (Latest) ⓘ | N/A | 1.33 |
| Net Debt / EBIT (5Y Median) ⓘ | N/A | 1.83 |
| Net Debt / EBITDA (Latest) ⓘ | N/A | 0.99 |
| Net Debt / Assets ⓘ | -20.86% | 5.33% |
| EBITDA / Interest ⓘ | N/A | 9.63 |
| Operating Margin (Latest) ⓘ | -58.06% | 9.25% |
| Operating Margin (5Y Median) ⓘ | N/A | 7.80% |
| Debt to Equity (Latest) ⓘ | 16.43% | 28.99% |
| Profit Margin (Latest) ⓘ | -49.45% | 3.60% |
| Free Cash Flow (Latest) ⓘ | -$62.96M | |
Momentum (Price trend) | ||
| 3Y Return ⓘ | N/A | +37.48% |
| 12M Return (excl. last month) ⓘ | N/A | +20.85% |
| 6M Return ⓘ | N/A | +9.73% |
| Price vs. 200-Day MA ⓘ | N/A | +4.69% |
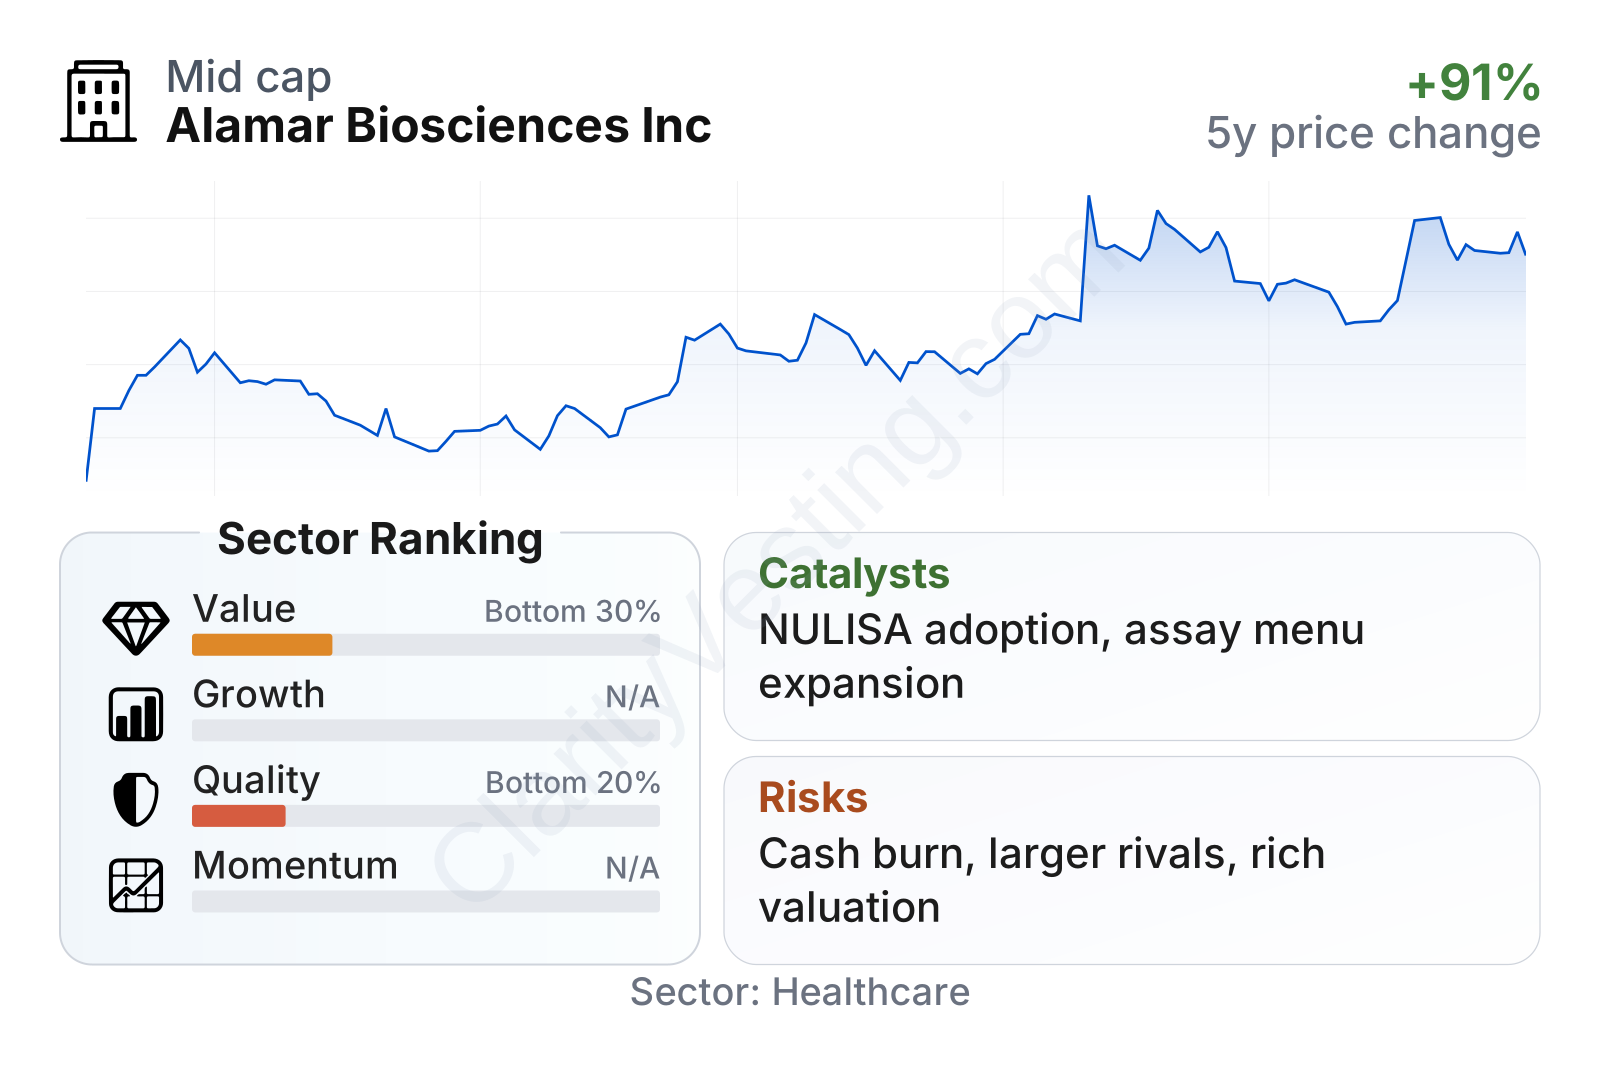
The recent metrics point to a company with very fast expansion but still weak profitability. Revenue growth is far above the healthcare sector median, which supports the idea that Alamar is in a strong commercialization phase. At the same time, margins remain deeply negative and free cash flow is still negative, which explains why quality and value measures rank below much of the sector.
Balance sheet risk appears more manageable than the income statement might suggest. Debt is relatively modest, and net cash remains a positive support, which is useful for a company still investing heavily ahead of full operating scale. The stock’s move from the mid-teens to the mid-twenties over the period shown also suggests that the market has been reacting to improving business traction, not current profitability.
Growth
Alamar is positioned in a growing segment of healthcare tools. Proteomics is benefiting from several long-term trends: more biomarker-driven drug development, rising use of blood-based testing in research, and a broader push toward detecting disease earlier and more accurately. These trends are not dependent on a single therapy area, which gives platform companies a potentially wide addressable market if their technology performs well.
The company’s strategy is coherent for this stage of development. It is investing heavily in research and development while also building commercial reach. That combination can be costly in the short run, but it is typical for an emerging tools platform trying to become embedded in customer workflows. If labs adopt the NULISA platform and build studies around it, switching becomes less convenient, and future consumables demand can become more recurring.
A major catalyst is proof that the platform can win recognition from high-quality customers. In this industry, adoption by leading academic centers, biopharma companies, and translational research groups often matters more than near-term earnings because it can validate performance and support later expansion. Another important catalyst is menu expansion: more assays and broader biomarker panels can increase revenue per customer and make the platform useful in more research settings.
Recent company updates have pointed to continued commercial progress, expanding customer use, and growing interest in applications tied to neurology, oncology, and other disease areas where very high sensitivity is valuable. The scale of year-over-year revenue growth, above 80%, also indicates that the company is not just benefiting from an attractive market theme; it is translating that theme into actual sales growth.
Risks
This article is for informational purposes only and does not constitute financial advice. Some content is AI-generated. See Disclaimer


