Stock Analysis · Ally Financial Inc (ALLY)
Overview
Ally Financial is a digital financial services company centered on consumer banking and auto finance. It is best known for offering auto loans and leases, dealer financing, online banking products such as deposits and savings accounts, insurance tied to vehicle ownership, and a smaller corporate finance operation. Unlike traditional banks with large branch networks, Ally operates primarily through digital channels, which helps keep its physical footprint light while relying heavily on technology, brand recognition, and long-standing relationships with auto dealers.
The company’s revenue is mainly driven by net financing revenue, which is the spread between what it earns on loans and investments and what it pays for funding, especially deposits and other borrowings. Based on recent annual reporting, the business mix can be described approximately as follows:
- Automotive Finance operations: about 70% to 80% of adjusted earnings power in a typical year. This includes retail auto lending, auto leases, and dealer floorplan financing.
- Insurance: about 10% to 15%. This segment includes vehicle service contracts, GAP products, and other auto-related protection products sold through dealer channels.
- Corporate Finance: about 5% to 10%. This business provides senior secured lending and other financing solutions to middle-market companies.
- Consumer and Commercial Banking / Treasury activities: the remainder, with deposits playing a critical funding role rather than standing alone as a fee-heavy revenue engine. Deposit gathering supports the broader lending franchise and helps fund auto and other loans.
That mix matters because Ally is not a broad universal bank. Its performance is still closely tied to credit quality, used-car values, interest rates, and the health of the U.S. auto market. Over the last few years, revenue expanded meaningfully, but earnings came under pressure as funding costs rose and credit normalized from unusually favorable post-pandemic levels. The business still generates solid scale, but profits have been more volatile than revenue.
The long-term pattern shows a business with much higher revenue than a few years ago, but also with heavier interest expense and a much thinner profit outcome. In other words, Ally’s challenge has not been demand alone; it has been preserving margins as funding became more expensive and credit costs moved closer to normal.
Key Figures
| Metric | Value | Sector ⓘ |
|---|---|---|
| Date | Oct 03, 2026 | |
| Context | ||
| Sector | Financial Services | |
| Industry | Credit Services | |
| Market Cap ⓘ | $11.44B | |
| Beta ⓘ | 1.07 | |
Value (Cheapness) | ||
| P/E Ratio ⓘ | 8.85 | 12.60 |
| P/B Ratio ⓘ | 0.76 | 1.23 |
| FCF Yield ⓘ | -5.32% | 10.16% |
| Dividend Yield ⓘ | 3.17% | 2.96% |
| EBIT / EV ⓘ | N/A | 7.77% |
| PEG ⓘ | 0.34 | |
Growth (Business expansion) | ||
| Revenue Growth ⓘ | 11.00% | 9.50% |
| RPS Growth (5Y CAGR) ⓘ | 12.20% | 12.10% |
| EPS Growth (5Y CAGR) ⓘ | -22.36% | -9.45% |
| BVPS Growth (5Y CAGR) ⓘ | 5.16% | 5.01% |
| Margin Growth (5Y Trend) ⓘ | -63.78% | -4.07% |
| FCF Growth (5Y CAGR) ⓘ | -11.98% | 4.96% |
| DPS Growth (5Y CAGR) ⓘ | 10.51% | 8.79% |
Quality (Business durability) | ||
| ROIC (Latest) ⓘ | N/A | 9.60% |
| ROE (Latest) ⓘ | 9.15% | 13.84% |
| ROA (Latest) ⓘ | 0.74% | 1.53% |
| ROIC (5Y Median) ⓘ | 3.08% | 7.86% |
| ROE (5Y Median) ⓘ | 6.99% | 12.20% |
| ROA (5Y Median) ⓘ | 0.49% | 1.29% |
| Net Debt / EBIT (Latest) ⓘ | N/A | 0.91 |
| Net Debt / EBIT (5Y Median) ⓘ | 10.69 | 0.74 |
| Net Debt / EBITDA (Latest) ⓘ | 4.99 | 0.97 |
| Operating Margin (Latest) ⓘ | N/A | 22.12% |
| Operating Margin (5Y Median) ⓘ | 8.65% | 24.39% |
| Debt to Equity (Latest) ⓘ | 148.27% | 60.37% |
| Profit Margin (Latest) ⓘ | 18.41% | 26.62% |
| Free Cash Flow (Latest) ⓘ | -$609.00M | |
Momentum (Price trend) | ||
| 3Y Return ⓘ | +61.65% | +89.23% |
| 12M Return (excl. last month) ⓘ | +4.90% | +17.35% |
| 6M Return ⓘ | -4.02% | +10.00% |
| Price vs. 200-Day MA ⓘ | -10.95% | +3.73% |
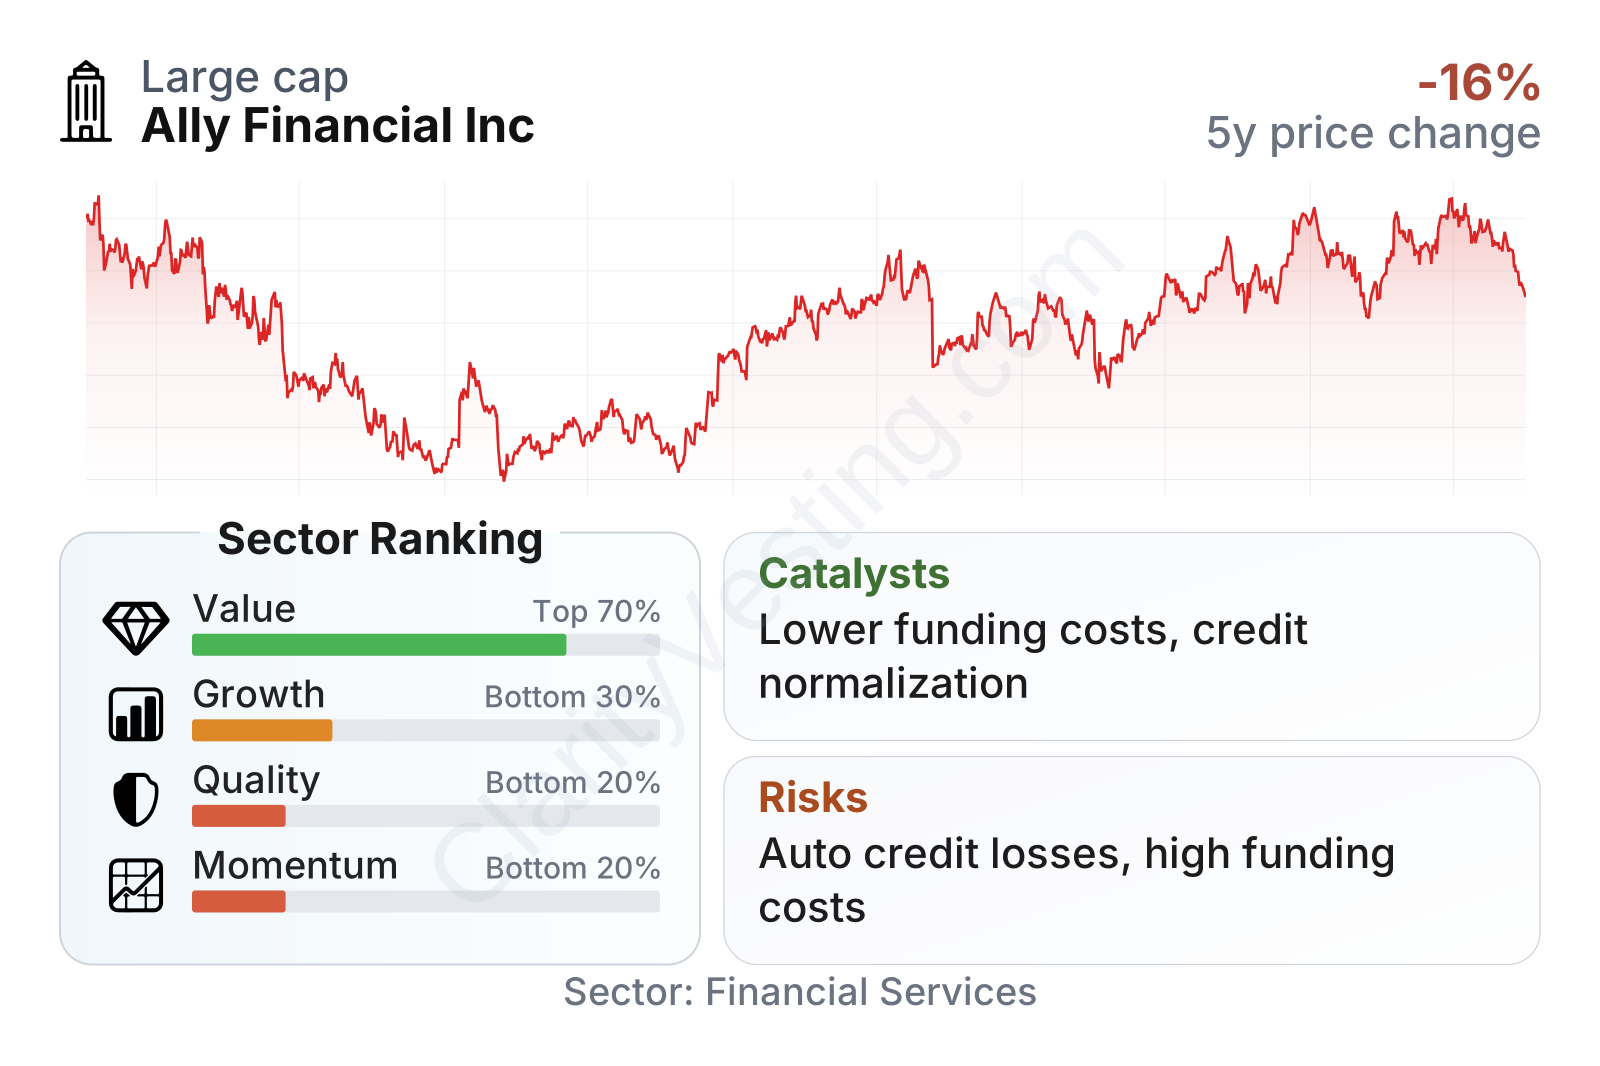
Ally is a mid-sized financial company with a market value in the low tens of billions of dollars and a share-price volatility close to the broader market. On valuation metrics, it screens cheaper than the sector median, with a price-to-earnings ratio around 9 and a price-to-book ratio below 1. Its dividend yield is also slightly above the sector median. The weaker side is quality and momentum: profitability measures sit below many peers, leverage is elevated, free cash flow is negative on this measure, and the stock’s recent trading trend has lagged much of the financial sector.
Growth
Ally operates in parts of financial services that should remain relevant for many years. Auto financing is not a fast-growth technology niche, but it is a large and durable market. The more interesting long-term angle is the shift toward digital banking and direct-to-consumer financial relationships. Ally’s branch-light model fits that trend well. If it can keep gathering relatively low-cost deposits and pair them with disciplined lending, that operating model can remain attractive even in a mature industry.
The company’s strategy also makes practical sense. It combines a strong dealer-based auto franchise with an online bank that helps fund lending. That pairing can be a real advantage because deposits are generally a more stable funding source than wholesale markets. Ally has also been emphasizing underwriting discipline, balance-sheet optimization, and tighter expense control. Those are not exciting themes, but they are important for a lender coming out of a period of higher credit losses and elevated rates.
Earnings per share illustrate the key issue clearly: profitability has fallen sharply from the unusually strong 2021 level and has not yet rebuilt to where it was earlier in the cycle. That does not automatically mean the business is structurally impaired, but it does show that recent growth in revenue has not translated into comparable growth in per-share earnings. For long-term analysis, the main question is whether Ally is now moving through a temporary normalization period or facing a lower-profit model than before.
Book value per share has held up better than earnings and has generally trended upward after the sharp drop seen in 2022. For a lender, that matters because book value reflects the capital base supporting future growth and loss absorption. A rising book value alongside subdued profitability can suggest that the company still has franchise value even while current returns remain under pressure.
A meaningful catalyst is the eventual easing of funding pressure if interest rates stabilize or decline. That could help net interest margins, especially if deposit costs stop climbing faster than loan yields. Another potential support is a more normal used-car market. During the last few years, used-car prices and credit performance moved in unusual ways; a steadier environment can make underwriting outcomes easier to predict. The company has also continued to highlight its dealer network, deposit franchise, and insurance business as areas that can support earnings resilience.
Recent company communications have also emphasized capital return capacity, expense discipline, and credit improvement efforts. None of these alone transforms the business, but together they could improve returns if the credit cycle stops worsening. For Ally, the biggest upside usually comes not from rapid expansion but from margin recovery and better loss performance.
Risks
This article is for informational purposes only and does not constitute financial advice. Some content is AI-generated. See Disclaimer


