Stock Analysis · Alaska Air Group Inc (ALK)
Overview
Alaska Air Group is a U.S. airline holding company whose main operations are passenger air transportation. Its best-known brands are Alaska Airlines and Horizon Air, and after the acquisition of Hawaiian Holdings, the group also includes Hawaiian Airlines. The company focuses on domestic flying in the United States, strong positions on the West Coast, service to Alaska and Hawaii, and selected international and cargo activity. In simple terms, it makes money by selling airline tickets and by earning additional fees and loyalty-related revenue around those trips.
The business is still overwhelmingly centered on air travel. Based on recent annual reporting, revenue is mainly generated from the following sources:
- Passenger revenue: about 85% to 90% of total revenue. This includes tickets sold for main cabin, premium seating, first class, and other scheduled passenger flying across Alaska, Hawaiian, and regional operations.
- Loyalty and other partner-related revenue: about 8% to 12%. This mainly comes from the Mileage Plan and HawaiianMiles ecosystems, especially sales of miles to bank card partners and other commercial partners.
- Cargo and other revenue: about 2% to 5%. This includes freight, ancillary fees, and various smaller operating sources.
That mix matters because ticket sales are cyclical and sensitive to travel demand, while loyalty revenue is usually more stable and higher quality. For Alaska Air Group, the strategic appeal is that it combines a traditional airline with a valuable loyalty platform and a stronger network after the Hawaiian combination.
The long-term financial picture shows a company that rebuilt revenue strongly after the pandemic period. Total revenue rose from roughly $6.2 billion in 2021 to about $11.7 billion in 2024, and then moved above $14 billion in 2025. At the same time, costs have remained a central issue, especially fuel, labor, aircraft ownership, and integration expenses tied to the Hawaiian deal.
The flow of revenue and costs shows a business that has clearly expanded in size, but not with smooth profit conversion. Revenue has grown materially over the last several years, while interest expense and operating costs have also increased, which helps explain why stronger scale has not translated into consistently strong margins.
Key Figures
| Metric | Value | Sector ⓘ |
|---|---|---|
| Date | Oct 17, 2026 | |
| Context | ||
| Sector | Industrials | |
| Industry | Airlines | |
| Market Cap ⓘ | $4.22B | |
| Beta ⓘ | 1.33 | |
Value (Cheapness) | ||
| P/E Ratio ⓘ | N/A | 22.10 |
| P/B Ratio ⓘ | 1.10 | 1.97 |
| FCF Yield ⓘ | -8.30% | 6.38% |
| Dividend Yield ⓘ | N/A | 1.94% |
| EBIT / EV ⓘ | -1.83% | 4.79% |
| PEG ⓘ | 1.20 | |
Growth (Business expansion) | ||
| Revenue Growth ⓘ | 9.70% | 9.30% |
| RPS Growth (5Y CAGR) ⓘ | 25.62% | 7.81% |
| EPS Growth (5Y CAGR) ⓘ | N/A | -13.06% |
| BVPS Growth (5Y CAGR) ⓘ | 4.01% | 6.14% |
| Margin Growth (5Y Trend) ⓘ | 7.67% | 0.88% |
| FCF Growth (5Y CAGR) ⓘ | N/A | 11.01% |
| DPS Growth (5Y CAGR) ⓘ | N/A | 9.48% |
Quality (Business durability) | ||
| ROIC (Latest) ⓘ | -1.74% | 10.84% |
| ROA (Latest) ⓘ | -0.85% | 5.41% |
| ROIC (5Y Median) ⓘ | 8.11% | 9.38% |
| ROA (5Y Median) ⓘ | 1.51% | 4.95% |
| Net Debt / EBIT (Latest) ⓘ | N/A | 2.08 |
| Net Debt / EBIT (5Y Median) ⓘ | 5.36 | 2.27 |
| Net Debt / EBITDA (Latest) ⓘ | 10.17 | 1.39 |
| Net Debt / Assets ⓘ | 30.68% | 19.28% |
| EBITDA / Interest ⓘ | 1.44 | 9.58 |
| Operating Margin (Latest) ⓘ | -1.17% | 10.50% |
| Operating Margin (5Y Median) ⓘ | 7.32% | 10.29% |
| Debt to Equity (Latest) ⓘ | 207.52% | 65.48% |
| Profit Margin (Latest) ⓘ | -1.18% | 6.67% |
| Free Cash Flow (Latest) ⓘ | -$350.00M | |
Momentum (Price trend) | ||
| 3Y Return ⓘ | +8.04% | +61.68% |
| 12M Return (excl. last month) ⓘ | -35.76% | +12.58% |
| 6M Return ⓘ | -16.17% | 0.00% |
| Price vs. 200-Day MA ⓘ | -20.43% | +0.02% |
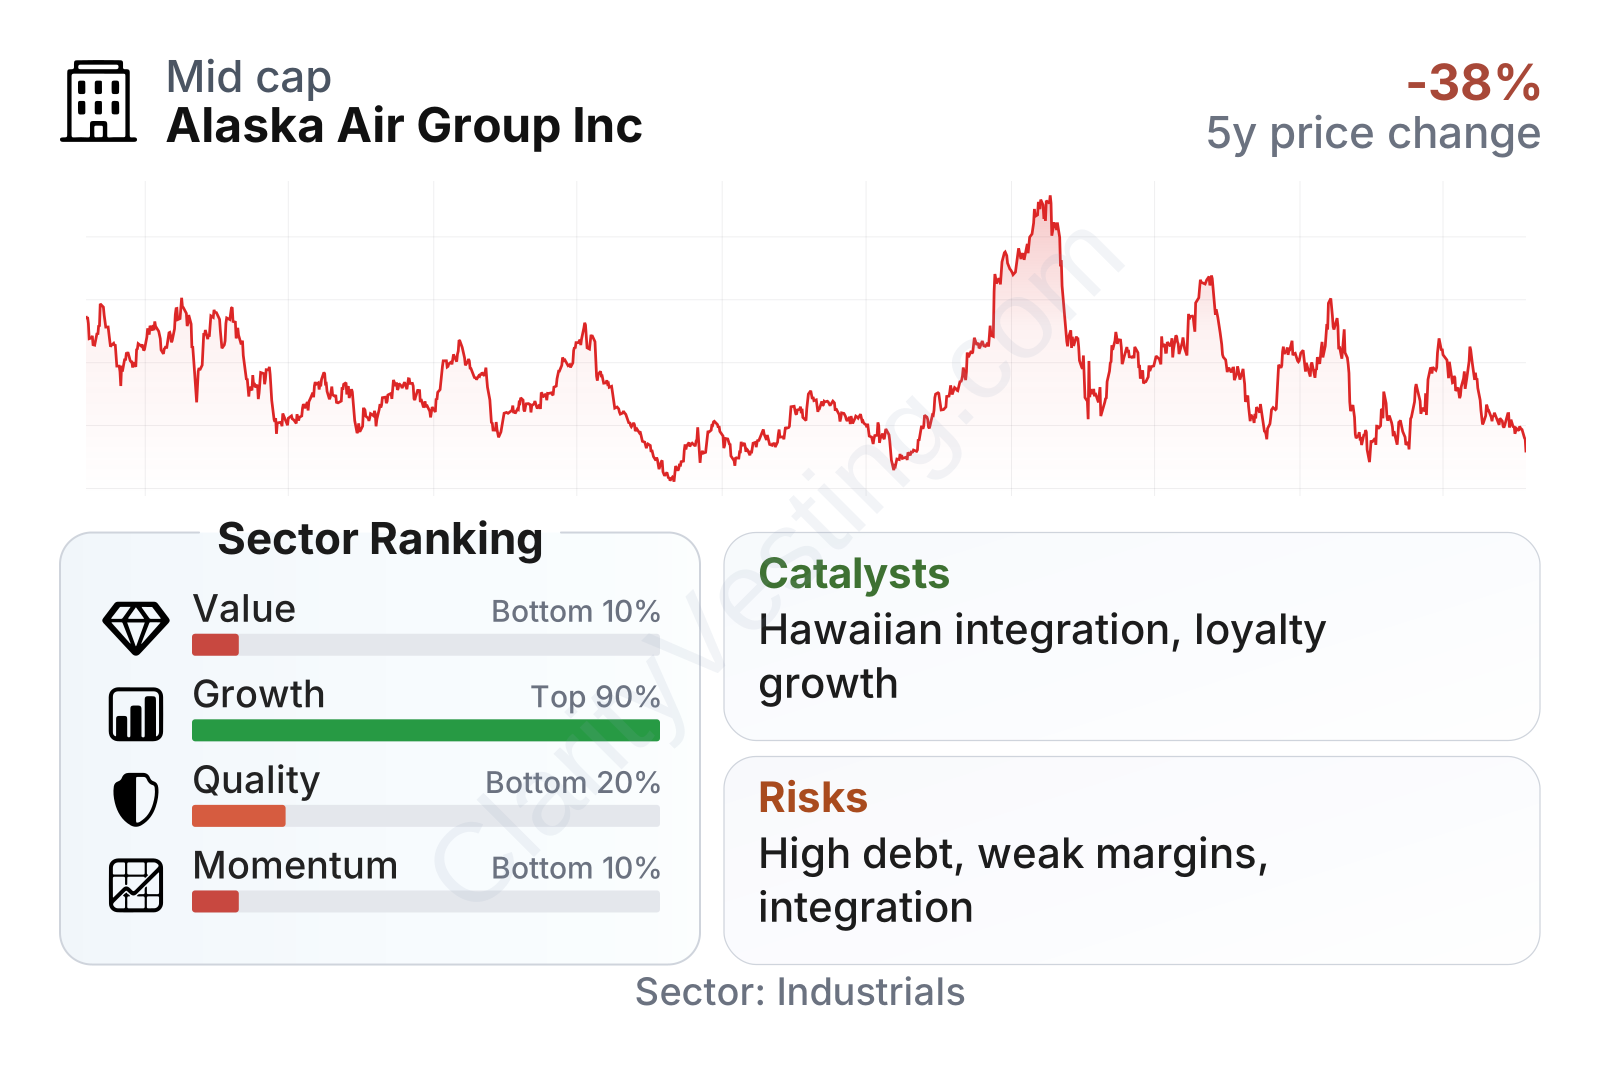
Alaska Air Group is a mid-sized public company with a stock that has been volatile over the last several years, which is typical for airlines. The latest factor picture is mixed. Growth ranks well versus much of the broader industrial sector, helped by solid revenue expansion and a strong multi-year increase in revenue per share. However, quality and momentum rank weakly, reflecting negative trailing profitability, negative free cash flow, and stock performance that has lagged the sector over longer periods. The value profile also looks weak on a screen-based basis, largely because traditional valuation ratios become less useful when recent earnings and cash flow are under pressure.
Growth
Air travel is a mature industry, but it still offers pockets of growth. Demand tends to increase over time with population growth, business activity, tourism, and premium travel demand. Alaska Air Group’s opportunity is not that it operates in a fast-moving technology market; it is that it can grow by improving network reach, filling more seats efficiently, increasing premium and loyalty revenue, and extracting synergies from combining airlines.
A major long-term catalyst is the integration of Hawaiian Airlines. The combination expands Alaska Air Group’s position in Hawaii, strengthens its relevance across the Pacific, and gives it a broader customer base for its loyalty programs. It also creates potential network benefits through better aircraft utilization, coordinated scheduling, and more connecting traffic. If management executes well, the deal could improve both scale and revenue diversity.
Another meaningful growth driver is loyalty. Airline loyalty programs can be highly valuable because they generate recurring revenue from co-branded credit card relationships and customer retention. Alaska’s Mileage Plan has historically been a strong competitive asset, and adding Hawaiian’s customer base may create cross-selling and network benefits over time.
Revenue growth has normalized after the sharp post-pandemic rebound, but the recent pattern still points to expansion rather than stagnation. The latest year-over-year growth rate is around 10%, slightly ahead of the sector median in the factor table. That is encouraging because it suggests the company is still growing even after the easy recovery phase has passed.
The weaker point is cash generation. Free cash flow has swung between positive and negative territory, and the latest trailing figure is negative. For an airline, that can happen during periods of heavy aircraft spending, integration costs, or margin pressure. It does not eliminate the growth case, but it does mean the company still needs to prove that larger scale can consistently turn into durable cash production.
Recent company updates have also emphasized fleet renewal, premium product improvements, and international network opportunities connected to the Hawaiian acquisition. Those moves fit the industry’s economics: airlines generally create value by improving unit revenue, attracting higher-paying travelers, and building loyalty rather than simply chasing volume.
Risks
This article is for informational purposes only and does not constitute financial advice. Some content is AI-generated. See Disclaimer