Stock Analysis · Alliance Witan Plc (ALITF)
Overview
Alliance Witan Plc is a listed investment company based in the United Kingdom. Rather than operating a traditional industrial business, it invests shareholders’ capital across a broad portfolio of public equities through a multi-manager approach. In simple terms, the company pools money, hires several specialist external stock pickers, and owns stakes in many companies around the world. Its goal is long-term growth in net asset value and dividends through diversified global equity exposure.
The current company was formed through the combination of Alliance Trust and Witan, creating a larger global investment trust with broader scale. That matters because size can improve trading efficiency, lower the cost base per shareholder, and make the shares more relevant for institutions and wealth platforms.
Its economic engine is different from that of a bank or insurer. Revenue and profit mainly come from investment returns on the underlying portfolio, along with dividend income received from investee companies. Because of that structure, reported revenue and earnings can swing sharply from year to year depending on market conditions, even when the underlying strategy remains consistent.
The main sources of income are approximately:
- Net gains on investments: the dominant driver in most positive years, typically the large majority of reported income. This includes realized and unrealized gains from the global equity portfolio.
- Dividend and investment income: a smaller but recurring portion, generated by cash distributions from portfolio holdings and other investment-related income.
- Other income: limited in size relative to the portfolio returns and not usually a major contributor.
For an investment trust like Alliance Witan, it is usually more useful to focus on net asset value, discount or premium to net asset value, total return, costs, and dividend progression than on conventional sales mix. The business is fundamentally a vehicle for compounding capital through globally diversified equity ownership.
The profit flow over recent years shows how market-sensitive this model is: results were very strong in 2021 and 2023, negative in 2022 during weaker markets, and still profitable afterward but at a lower level. Operating expenses stayed comparatively modest against portfolio gains and losses, which highlights that performance is driven far more by investment returns than by changes in the cost base.
Key Figures
| Metric | Value | Sector ⓘ |
|---|---|---|
| Date | Oct 17, 2026 | |
| Context | ||
| Sector | Financial Services | |
| Industry | Asset Management | |
| Market Cap ⓘ | $5.32B | |
| Beta ⓘ | 0.46 | |
Value (Cheapness) | ||
| P/E Ratio ⓘ | 7.32 | 12.26 |
| P/B Ratio ⓘ | 1.47 | 1.23 |
| FCF Yield ⓘ | 1.97% | 10.40% |
| Dividend Yield ⓘ | 1.87% | 3.02% |
| EBIT / EV ⓘ | N/A | 8.14% |
| PEG ⓘ | N/A | |
Growth (Business expansion) | ||
| Revenue Growth ⓘ | 13007.30% | 9.35% |
| RPS Growth (5Y CAGR) ⓘ | -19.16% | 12.19% |
| EPS Growth (5Y CAGR) ⓘ | N/A | -9.53% |
| BVPS Growth (5Y CAGR) ⓘ | 4.99% | 4.99% |
| Margin Growth (5Y Trend) ⓘ | -3.18% | -3.86% |
| FCF Growth (5Y CAGR) ⓘ | 6.92% | 4.81% |
| DPS Growth (5Y CAGR) ⓘ | 5.37% | 8.79% |
Quality (Business durability) | ||
| ROIC (Latest) ⓘ | N/A | 9.49% |
| ROE (Latest) ⓘ | 14.18% | 13.90% |
| ROA (Latest) ⓘ | 13.18% | 1.55% |
| ROIC (5Y Median) ⓘ | N/A | 7.86% |
| ROE (5Y Median) ⓘ | 11.47% | 12.17% |
| ROA (5Y Median) ⓘ | 10.70% | 1.30% |
| Net Debt / EBIT (Latest) ⓘ | N/A | 0.96 |
| Net Debt / EBIT (5Y Median) ⓘ | N/A | 0.73 |
| Net Debt / EBITDA (Latest) ⓘ | N/A | 0.92 |
| Operating Margin (Latest) ⓘ | N/A | 22.30% |
| Operating Margin (5Y Median) ⓘ | 96.44% | 24.63% |
| Debt to Equity (Latest) ⓘ | 7.65% | 58.56% |
| Profit Margin (Latest) ⓘ | 91.16% | 26.57% |
| Free Cash Flow (Latest) ⓘ | $105.11M | |
Momentum (Price trend) | ||
| 3Y Return ⓘ | +28.07% | +88.33% |
| 12M Return (excl. last month) ⓘ | -7.10% | +19.38% |
| 6M Return ⓘ | -1.13% | +4.75% |
| Price vs. 200-Day MA ⓘ | +34.45% | +3.50% |
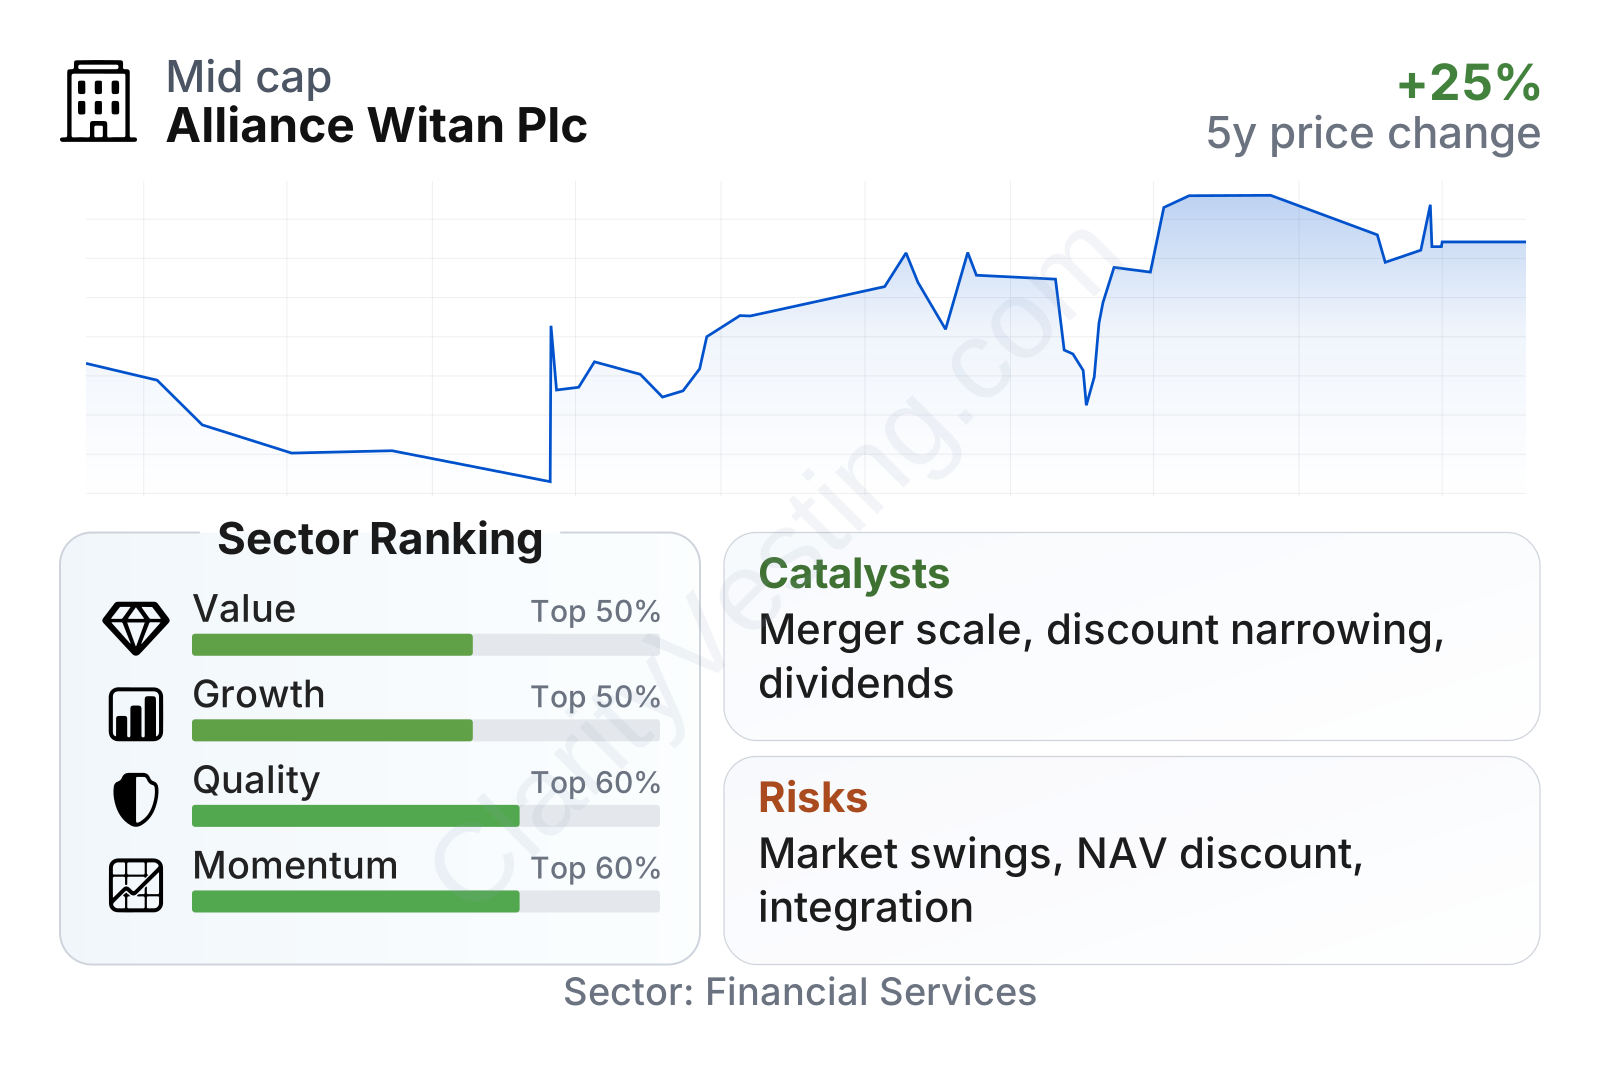
Alliance Witan sits in the middle-to-upper part of the sector on several broad measures, but the profile is mixed. Valuation looks modest on earnings, with a P/E below the sector median, while the price-to-book ratio is slightly above the sector median. Quality is supported by strong profitability relative to assets and low leverage, but growth readings are distorted by the ups and downs of investment markets and by the trust’s merger-related changes. Share-price momentum has been decent over a multi-year period, though more recent performance has been softer than the sector median.
The company is also relatively low-volatility for an equity-linked financial stock, with a beta well below 1. That does not remove market risk, but it suggests the shares have historically moved less than the broader market.
Growth
Alliance Witan operates in a mature but durable segment: listed investment vehicles that give shareholders access to diversified portfolios. This is not a high-growth niche in the way software or semiconductors might be, but it is tied to long-term global wealth creation and demand for simple, diversified equity exposure. The larger combined entity can also benefit from scale, broader recognition, and potentially lower running costs over time.
The strategic logic appears sensible for long-term expansion in net asset value per share. The company spreads assets across multiple external managers with different styles, which reduces dependence on any one individual or investment philosophy. That can be attractive in periods when leadership rotates across regions, sectors, or investment styles. The merger that created Alliance Witan also added assets and visibility, which may help secondary-market liquidity and improve the company’s standing among wealth managers and platforms.
Recent earnings progression underlines both the opportunity and the variability of the model.
Earnings moved from a strong full-year level in 2024 to a small interim loss in 2025, which is not unusual for an investment company exposed to changing markets. What matters more over the long run is whether net asset value and dividends continue to trend upward across cycles rather than whether each reporting period is smooth.
Book value per share gives a clearer picture of long-term wealth creation.
Book value rose meaningfully from 2021 through 2024 before giving back part of that increase in 2025. Even with that pullback, the multi-year pattern still points to underlying capital growth, and the five-year compound growth rate is around 5%. For this type of company, that is a more useful anchor than headline revenue growth, which can be unusually volatile because accounting results rise and fall with market movements.
A notable catalyst is the integration of the Alliance Trust and Witan combination into a larger, more scalable vehicle. Another is any sustained narrowing of the share price discount to net asset value, if achieved, because listed investment trusts often create shareholder value not only through portfolio performance but also through discount management. Continued dividend progression is also relevant, especially for a trust with a long income-paying tradition inherited from its predecessors.
Risks
This article is for informational purposes only and does not constitute financial advice. Some content is AI-generated. See Disclaimer


