Stock Analysis · Allegiant Travel Company (ALGT)
Overview
Allegiant Travel Company is a U.S. leisure travel company best known for Allegiant Air, an ultra-low-cost airline focused on connecting small and mid-sized cities to vacation destinations. Its model is different from the large network airlines: instead of trying to serve business travelers with frequent daily schedules, Allegiant concentrates on price-sensitive leisure travelers, limited-frequency routes, and bundled vacation-related products. The company also has a growing presence in resort operations through Sunseeker Resort, which adds a hospitality component to what was previously a more airline-centered business.
Revenue comes from a mix of air transportation and travel-related add-ons, with the airline still clearly dominating the business. Based on the latest annual filings, the main revenue sources can be summarized as follows:
- Passenger revenue: approximately 50% to 55% of total revenue. This is the base airfare paid by travelers.
- Third-party products revenue: approximately 20% to 25%. This includes items sold alongside air travel such as hotel rooms, rental cars, attraction tickets, and other travel services.
- Fixed fee contract revenue: approximately 10% to 15%. This comes largely from arrangements tied to Allegiant’s co-branded credit card and related loyalty economics.
- Baggage fees: approximately 8% to 10%. These are fees passengers pay for checked and carry-on bags.
- Other ancillary air-related revenue: approximately 8% to 12%. This includes seat assignments, priority boarding, change fees, and similar optional services.
- Sunseeker Resort and other non-airline activity: still a smaller share, but increasingly visible after the opening of the resort business.
That revenue mix matters because Allegiant is not just selling seats. A large share of its economics comes from add-on purchases and partner arrangements, which is typical of ultra-low-cost carriers and can support revenue per traveler even when base fares are pressured.
The longer-term picture, however, has become more mixed. Revenue has continued to expand, but profitability has been much more volatile as the company absorbed pressure from operating costs, higher interest expense, and the early ramp-up of its resort business. The business remains centered on leisure travel demand, but it now has more moving parts than a pure airline operator.
The financial flow over the last few years shows a business that has grown its revenue base from roughly $1.7 billion in 2021 to above $2.6 billion in 2025, but that growth has not translated cleanly into profit. Operating income and net income moved from solidly positive levels in 2021 and 2023 to losses in 2024 and a weaker result again in 2025, highlighting how sensitive Allegiant remains to execution, costs, and financing pressure.
Key Figures
| Metric | Value | Sector ⓘ |
|---|---|---|
| Date | Oct 03, 2026 | |
| Context | ||
| Sector | Industrials | |
| Industry | Airlines | |
| Market Cap ⓘ | $2.11B | |
| Beta ⓘ | 1.49 | |
Value (Cheapness) | ||
| P/E Ratio ⓘ | 66.41 | 22.45 |
| P/B Ratio ⓘ | 0.78 | 1.98 |
| FCF Yield ⓘ | 5.54% | 6.31% |
| Dividend Yield ⓘ | N/A | 1.96% |
| EBIT / EV ⓘ | 5.23% | 4.81% |
| PEG ⓘ | 0.85 | |
Growth (Business expansion) | ||
| Revenue Growth ⓘ | 36.90% | 9.10% |
| RPS Growth (5Y CAGR) ⓘ | 9.87% | 7.75% |
| EPS Growth (5Y CAGR) ⓘ | 18.75% | -13.59% |
| BVPS Growth (5Y CAGR) ⓘ | -4.80% | 6.22% |
| Margin Growth (5Y Trend) ⓘ | -12.54% | 0.72% |
| FCF Growth (5Y CAGR) ⓘ | -28.94% | 10.98% |
| DPS Growth (5Y CAGR) ⓘ | N/A | 9.48% |
Quality (Business durability) | ||
| ROIC (Latest) ⓘ | 4.08% | 10.92% |
| ROA (Latest) ⓘ | 0.48% | 5.41% |
| ROIC (5Y Median) ⓘ | 2.60% | 9.21% |
| ROA (5Y Median) ⓘ | 0.06% | 4.94% |
| Net Debt / EBIT (Latest) ⓘ | 14.62 | 2.07 |
| Net Debt / EBIT (5Y Median) ⓘ | 13.30 | 2.28 |
| Net Debt / EBITDA (Latest) ⓘ | 5.64 | 1.43 |
| Net Debt / Assets ⓘ | 36.36% | 19.27% |
| EBITDA / Interest ⓘ | 3.05 | 9.53 |
| Operating Margin (Latest) ⓘ | 5.54% | 10.50% |
| Operating Margin (5Y Median) ⓘ | 4.69% | 10.27% |
| Debt to Equity (Latest) ⓘ | 160.47% | 65.48% |
| Profit Margin (Latest) ⓘ | 0.90% | 6.62% |
| Free Cash Flow (Latest) ⓘ | $116.69M | |
Momentum (Price trend) | ||
| 3Y Return ⓘ | +1.43% | +58.56% |
| 12M Return (excl. last month) ⓘ | +21.37% | +15.63% |
| 6M Return ⓘ | -6.48% | +4.19% |
| Price vs. 200-Day MA ⓘ | -15.06% | +0.93% |
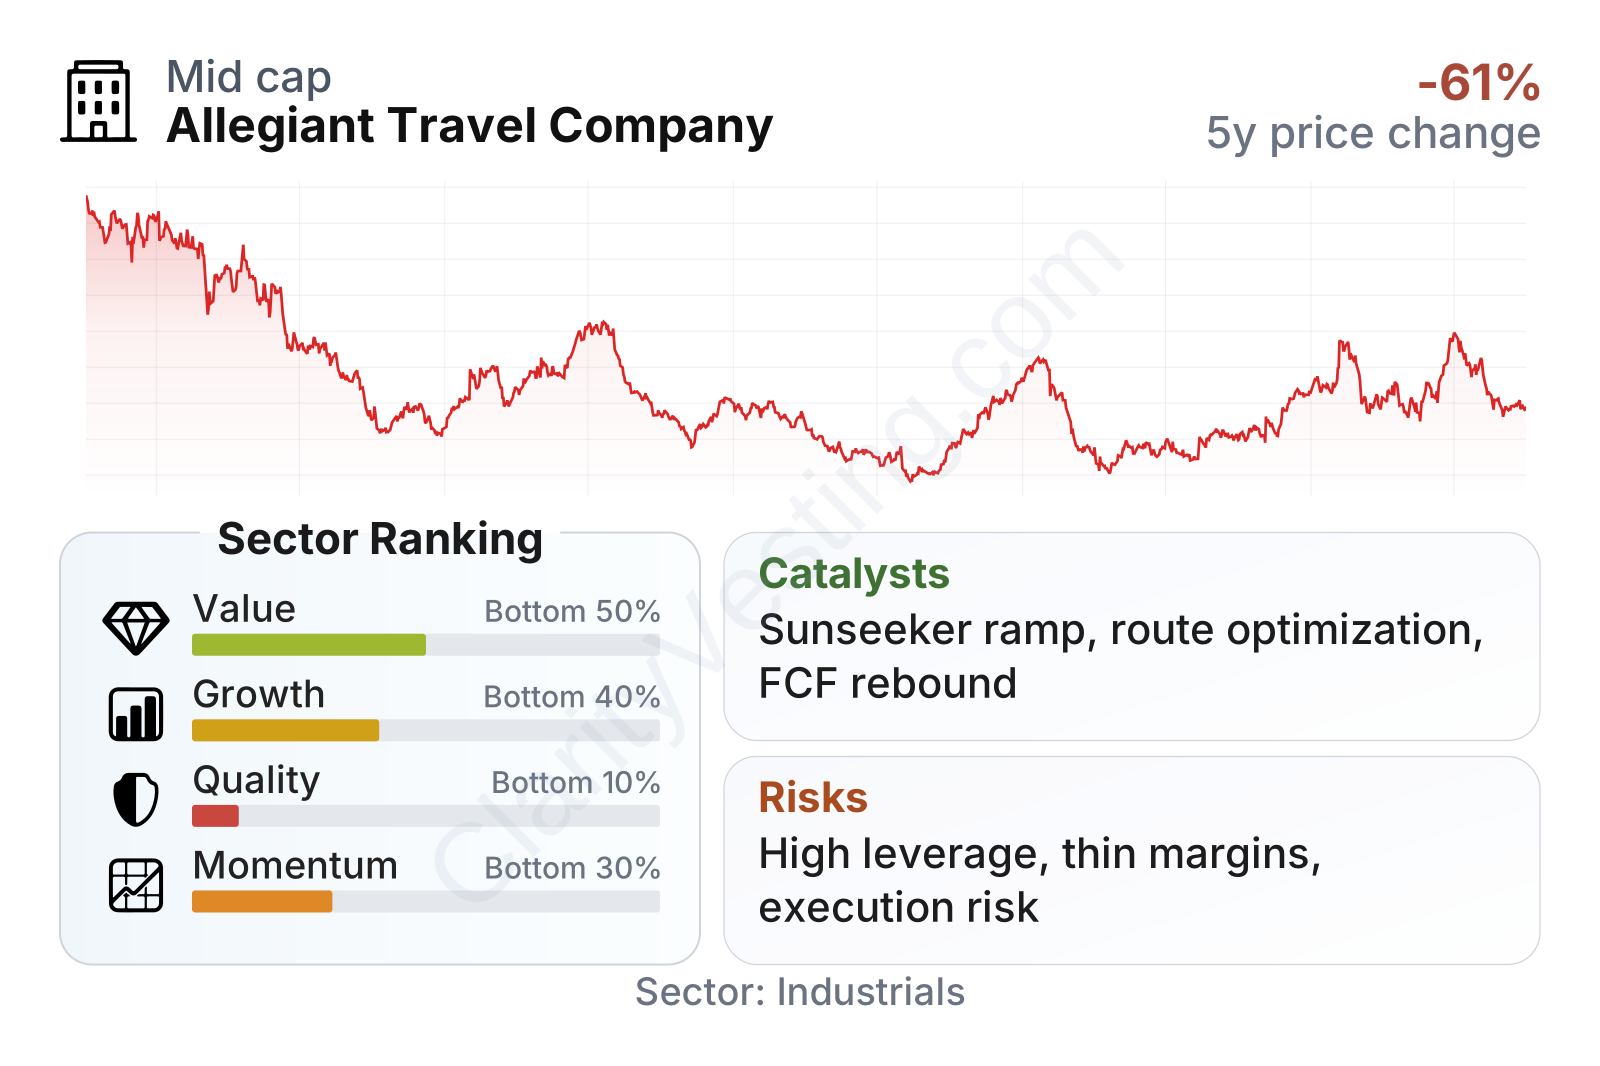
Allegiant is a mid-sized airline company with a stock that has been highly volatile over the last several years. The share price has recovered sharply from some low points, but the path has been uneven, which matches the company’s fluctuating earnings profile. In the latest metrics, growth looks better than the headline ranking suggests, especially on recent revenue and longer-term revenue-per-share trends. The weaker areas are business quality and balance-sheet strength: returns on capital are low, margins remain thin, and leverage is elevated compared with the broader industrial sector. Valuation signals are mixed, with a high earnings multiple but a lower price-to-book ratio, reflecting a company whose assets are substantial but whose recent profit base is still under pressure.
Growth
Allegiant operates in leisure air travel, which is a structurally resilient segment over long periods, although it is cyclical from year to year. Demand for domestic vacations, visiting friends and relatives, and value-oriented travel tends to hold up better than some discretionary categories, especially when consumers trade down on price. That gives Allegiant a useful niche: it is not trying to outcompete the largest airlines on network breadth, premium cabins, or corporate contracts. Instead, it focuses on underserved routes where nonstop service can stimulate demand.
Its strategy still makes logical sense for future expansion. The company’s route model allows it to enter city pairs that larger airlines may ignore, and its ancillary-heavy approach means each customer can generate revenue beyond the ticket price. On top of that, the company has been working through a fleet transition that should eventually improve reliability and operating efficiency if executed well. The hospitality business adds another layer of opportunity, because it can capture more spending from vacation travelers rather than only the flight portion.
Recent revenue momentum has improved notably, with year-over-year growth accelerating in the latest period after a much flatter stretch in 2024 and parts of 2025. That suggests the business may be moving past a softer phase, although airline revenue can swing quickly with capacity, pricing, and seasonal demand.
Cash generation has also improved from negative levels seen earlier in the cycle to positive trailing twelve-month free cash flow. That is important because Allegiant has been balancing aircraft spending, debt obligations, and the build-out of newer initiatives. Positive free cash flow does not remove all concerns, but it does show the company is not relying only on accounting recovery to stabilize its operations.
A meaningful catalyst is the ongoing maturation of Sunseeker Resort and the broader push to integrate travel offerings around the Allegiant customer base. If the resort reaches a steadier occupancy and margin profile, it could become a more meaningful earnings contributor over time. Another catalyst is better aircraft availability and fewer operational disruptions. Allegiant has previously dealt with fleet-related constraints, so improved reliability can support both revenue growth and cost control. In recent company updates, management has also emphasized network optimization and efforts to strengthen peak leisure travel performance, which could help margins if demand remains healthy.
Risks
This article is for informational purposes only and does not constitute financial advice. Some content is AI-generated. See Disclaimer