Stock Analysis · Aker BP ASA (AKRBF)
Overview
Aker BP ASA is a Norwegian oil and gas producer focused on exploring for petroleum, developing offshore fields, and operating producing assets on the Norwegian Continental Shelf. In simple terms, it finds hydrocarbons under the seabed, builds the infrastructure needed to extract them, and then sells the oil and natural gas it produces. Its business is concentrated in Norway, one of the world’s more stable offshore energy jurisdictions, and that gives the company a clearer regulatory setting than many global exploration and production peers.
The company’s revenue is overwhelmingly tied to production and sale of petroleum volumes. Based on Aker BP’s reporting structure and business model, the main sources of revenue are approximately:
- Crude oil sales: roughly 70% to 80% of revenue in a typical year. This is the largest driver and reflects the company’s oil-heavy production mix from major offshore fields.
- Natural gas sales: roughly 15% to 25% of revenue. This includes gas produced from the same offshore asset base and sold into European markets.
- Liquids such as NGL/condensate and other operating income: roughly 0% to 10%. This is smaller and can vary depending on field mix and realized prices.
Aker BP does not have the broad diversification of an integrated major. It is primarily an upstream company, which means results depend heavily on production levels, operating costs, taxes, and commodity prices. That focus can create strong cash generation in supportive oil and gas markets, but it also makes earnings more cyclical than those of companies with refining, chemicals, or trading operations.
Over the last several years, revenue remained very large by industry standards, but profitability moved around much more sharply. Gross profit stayed substantial from 2021 through 2025, while net income was far more volatile, showing how taxes, price swings, and field-level operating conditions can have an outsized effect on what finally reaches shareholders.
The operating picture shows an important contrast: sales stayed above roughly $10 billion in each of the last four full years, but net income moved from very strong levels in 2022 and 2024 to a much weaker result in 2025. Interest expense, however, trended down materially over that period, which suggests debt servicing became less of a burden even while earnings volatility increased.
Key Figures
| Metric | Value | Sector ⓘ |
|---|---|---|
| Date | Oct 03, 2026 | |
| Context | ||
| Sector | Energy | |
| Industry | Oil & Gas E&P | |
| Market Cap ⓘ | $23.03B | |
| Beta ⓘ | -0.07 | |
Value (Cheapness) | ||
| P/E Ratio ⓘ | 16.91 | 14.47 |
| P/B Ratio ⓘ | 1.91 | 1.70 |
| FCF Yield ⓘ | 2.03% | 8.66% |
| Dividend Yield ⓘ | 7.06% | 3.77% |
| EBIT / EV ⓘ | 20.43% | 7.46% |
| PEG ⓘ | N/A | |
Growth (Business expansion) | ||
| Revenue Growth ⓘ | 42.00% | 27.35% |
| RPS Growth (5Y CAGR) ⓘ | 1.95% | 6.75% |
| EPS Growth (5Y CAGR) ⓘ | -24.14% | -15.45% |
| BVPS Growth (5Y CAGR) ⓘ | 28.54% | 5.85% |
| Margin Growth (5Y Trend) ⓘ | -25.30% | 0.75% |
| FCF Growth (5Y CAGR) ⓘ | N/A | 3.62% |
| DPS Growth (5Y CAGR) ⓘ | 16.79% | 16.85% |
Quality (Business durability) | ||
| ROIC (Latest) ⓘ | 24.13% | 11.33% |
| ROA (Latest) ⓘ | 1.79% | 6.03% |
| ROIC (5Y Median) ⓘ | 25.50% | 10.16% |
| ROA (5Y Median) ⓘ | 4.50% | 5.34% |
| Net Debt / EBIT (Latest) ⓘ | 0.98 | 1.62 |
| Net Debt / EBIT (5Y Median) ⓘ | 0.34 | 1.91 |
| Net Debt / EBITDA (Latest) ⓘ | 0.72 | 1.06 |
| Net Debt / Assets ⓘ | 12.64% | 17.29% |
| EBITDA / Interest ⓘ | 201.43 | 9.64 |
| Operating Margin (Latest) ⓘ | 53.07% | 16.32% |
| Operating Margin (5Y Median) ⓘ | 65.77% | 19.53% |
| Debt to Equity (Latest) ⓘ | N/A | 54.41% |
| Profit Margin (Latest) ⓘ | 11.94% | 8.79% |
| Free Cash Flow (Latest) ⓘ | $467.60M | |
Momentum (Price trend) | ||
| 3Y Return ⓘ | +71.23% | +62.93% |
| 12M Return (excl. last month) ⓘ | +58.91% | +44.83% |
| 6M Return ⓘ | -0.06% | -1.62% |
| Price vs. 200-Day MA ⓘ | +8.54% | +5.18% |
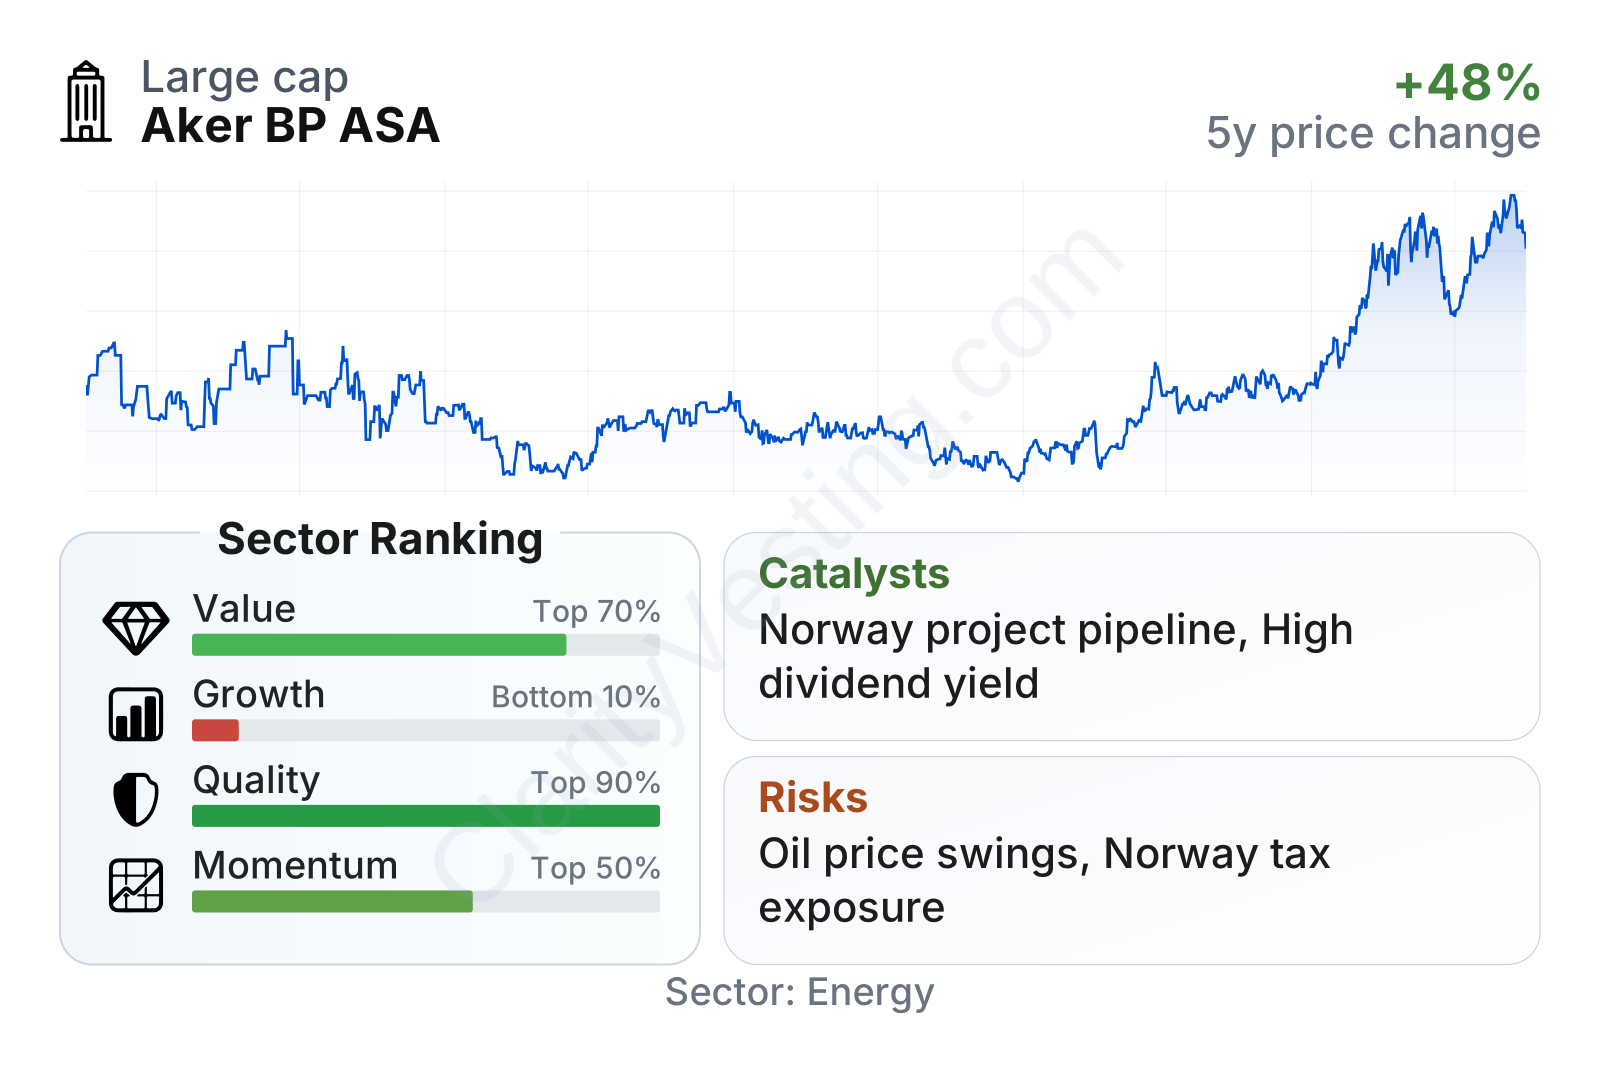
Aker BP is a large independent producer with a market value in the tens of billions of dollars. The stock’s recent market performance has been relatively strong versus much of the energy sector, but the underlying fundamental picture is more mixed. Valuation is not especially low on common measures such as earnings and book value, and free cash flow yield sits well below the sector median. On the other hand, the trailing dividend yield is notably higher than the industry midpoint, which helps explain part of the stock’s appeal.
The quality indicators are uneven. Profit margin is above the sector median on a trailing basis, and balance-sheet leverage looks manageable, with net debt equal to about 13% of assets, which is lower than the sector median. At the same time, return on assets is weaker than many peers, showing that the company is not converting its asset base into profits as efficiently as stronger operators in the group.
Growth metrics also need context. Recent year-over-year revenue growth rebounded sharply, but longer-term growth measures such as five-year revenue per share and earnings per share trends remain weaker than sector medians. That combination points to a company that can post strong short-term recoveries, while still facing a less convincing long-range compounding profile.
Growth
Aker BP operates in a sector with contradictory long-term forces. On one side, global decarbonization creates uncertainty for long-duration fossil fuel demand. On the other, oil and gas remain essential to transportation, industry, power balancing, and European energy security. For a producer like Aker BP, this means the broad sector is unlikely to deliver smooth structural growth, but efficient low-cost barrels in politically stable regions can still remain economically attractive for many years.
The company’s strategy is built around exactly that idea: concentrate on offshore Norway, develop known resources, tie new discoveries into existing infrastructure, and keep production efficiency high. This can be a sensible approach for long-term value creation because it lowers geological risk compared with frontier exploration and can improve returns on capital when new projects are connected to already-built hubs. Aker BP has also emphasized digitalization, subsea development, and a project pipeline designed to sustain production over time.
Revenue momentum has been uneven, which is normal for upstream producers, but the latest period shows a strong rebound of roughly 42% year over year. That is better than the sector median and indicates that production, pricing, or both improved materially in the most recent comparison. Still, the longer pattern shows alternating growth and contraction, so the business should be viewed as cyclical rather than steadily expanding.
Cash generation tells a similarly mixed but important story. Free cash flow was very strong in earlier periods, then came down sharply before stabilizing at lower levels. Even after that decline, the company remains cash generative, which matters because offshore development requires large capital spending and because shareholder distributions in this industry are only durable when backed by cash flow rather than accounting profits.
A major catalyst is Aker BP’s project portfolio on the Norwegian Continental Shelf, especially field developments intended to support production into the second half of the decade. The company has repeatedly highlighted major hubs and tie-back opportunities in its public materials, and these projects can matter more than short-term commodity moves because they shape future output, unit costs, and reserve life. Another supportive factor is Europe’s continued need for reliable regional gas supply, which adds strategic relevance to Norwegian producers.
Recent company updates have also pointed to continued development activity, reserve replacement efforts, and a focus on operational efficiency. For a long-term reader, the most significant opportunity is not explosive volume growth, but the possibility that Aker BP can keep producing substantial cash from a high-quality asset base while bringing new projects online in an orderly way.
Risks
This article is for informational purposes only and does not constitute financial advice. Some content is AI-generated. See Disclaimer


