Stock Analysis · Acadia Realty Trust (AKR)
Overview
Acadia Realty Trust is a retail-focused real estate investment trust, or REIT. In simple terms, it owns, operates, redevelops, and invests in shopping properties, with a strong emphasis on street retail and open-air centers in dense, high-income trade areas. Its portfolio is concentrated in major metropolitan markets and affluent suburbs, and the company also uses an investment management platform to invest alongside institutional partners in additional real estate opportunities.
Its business is built around collecting rent from retailers and creating value through leasing, redevelopment, acquisitions, and selective property sales. Compared with many retail landlords that focus mainly on large suburban shopping centers, Acadia’s positioning is more specialized: it aims for locations where tenant demand can remain stronger because of population density, household income, tourism, and limited available space.
The latest annual reporting shows revenue coming primarily from property operations, with a smaller contribution from its investment management activities and gains tied to real estate transactions. Exact mixes can shift from year to year because property sales and investment gains are less recurring than rent, but the broad structure is clear.
- Rental and other property income: approximately 80% to 90% of total revenue in a typical year. This includes base rent, percentage rent, recoveries from tenants, and other income generated by wholly owned and partially owned shopping and street retail properties.
- Investment management and fee-related income: approximately 5% to 10%. This comes from managing and structuring investments through funds and joint ventures with third-party capital partners.
- Realized and unrealized gains, property sales, and other transactional items: usually less predictable and often below 10%, but they can materially affect reported earnings in some periods.
Over the past several years, total revenue has generally moved upward, but profit conversion has been uneven. Revenue reached a new high in 2025, while operating income and net income weakened, suggesting that acquisitions, property mix changes, and transaction activity helped the top line more than the bottom line.
The long-term pattern is constructive on revenue, but recent profit pressure matters. Sales have expanded from the low $290 million range in 2021 to more than $400 million in 2025, while interest expense has stayed elevated and earnings have remained relatively modest for a company of this size.
Key Figures
| Metric | Value | Sector ⓘ |
|---|---|---|
| Date | Oct 17, 2026 | |
| Context | ||
| Sector | Real Estate | |
| Industry | REIT - Retail | |
| Market Cap ⓘ | $2.64B | |
| Beta ⓘ | 1.13 | |
Value (Cheapness) | ||
| P/E Ratio ⓘ | 53.21 | 17.38 |
| P/B Ratio ⓘ | 1.24 | 0.85 |
| FCF Yield ⓘ | 2.63% | 7.38% |
| Dividend Yield ⓘ | 4.38% | 4.85% |
| EBIT / EV ⓘ | 5.73% | 3.78% |
| PEG ⓘ | 4.70 | |
Growth (Business expansion) | ||
| Revenue Growth ⓘ | 13.40% | 5.30% |
| RPS Growth (5Y CAGR) ⓘ | -1.56% | 6.02% |
| EPS Growth (5Y CAGR) ⓘ | N/A | -11.37% |
| BVPS Growth (5Y CAGR) ⓘ | -5.40% | 0.45% |
| Margin Growth (5Y Trend) ⓘ | -18.63% | -0.22% |
| FCF Growth (5Y CAGR) ⓘ | 12.30% | 5.40% |
| DPS Growth (5Y CAGR) ⓘ | 14.46% | 5.02% |
Quality (Business durability) | ||
| ROIC (Latest) ⓘ | 6.02% | 5.69% |
| ROE (Latest) ⓘ | 2.66% | 7.56% |
| ROA (Latest) ⓘ | 1.16% | 2.85% |
| ROIC (5Y Median) ⓘ | 2.05% | 4.22% |
| ROE (5Y Median) ⓘ | 1.30% | 6.03% |
| ROA (5Y Median) ⓘ | 0.46% | 2.44% |
| Net Debt / EBIT (Latest) ⓘ | 7.10 | 7.59 |
| Net Debt / EBIT (5Y Median) ⓘ | 20.88 | 8.40 |
| Net Debt / EBITDA (Latest) ⓘ | 4.36 | 5.27 |
| Net Debt / Assets ⓘ | 37.76% | 37.76% |
| EBITDA / Interest ⓘ | 4.41 | 4.10 |
| Operating Margin (Latest) ⓘ | 60.72% | 35.29% |
| Operating Margin (5Y Median) ⓘ | 27.11% | 37.31% |
| Debt to Equity (Latest) ⓘ | 76.03% | 88.87% |
| Profit Margin (Latest) ⓘ | 13.21% | 19.61% |
| Free Cash Flow (Latest) ⓘ | $69.49M | |
Momentum (Price trend) | ||
| 3Y Return ⓘ | +46.39% | +30.75% |
| 12M Return (excl. last month) ⓘ | +1.11% | +4.36% |
| 6M Return ⓘ | -10.55% | -2.52% |
| Price vs. 200-Day MA ⓘ | -8.94% | -2.34% |
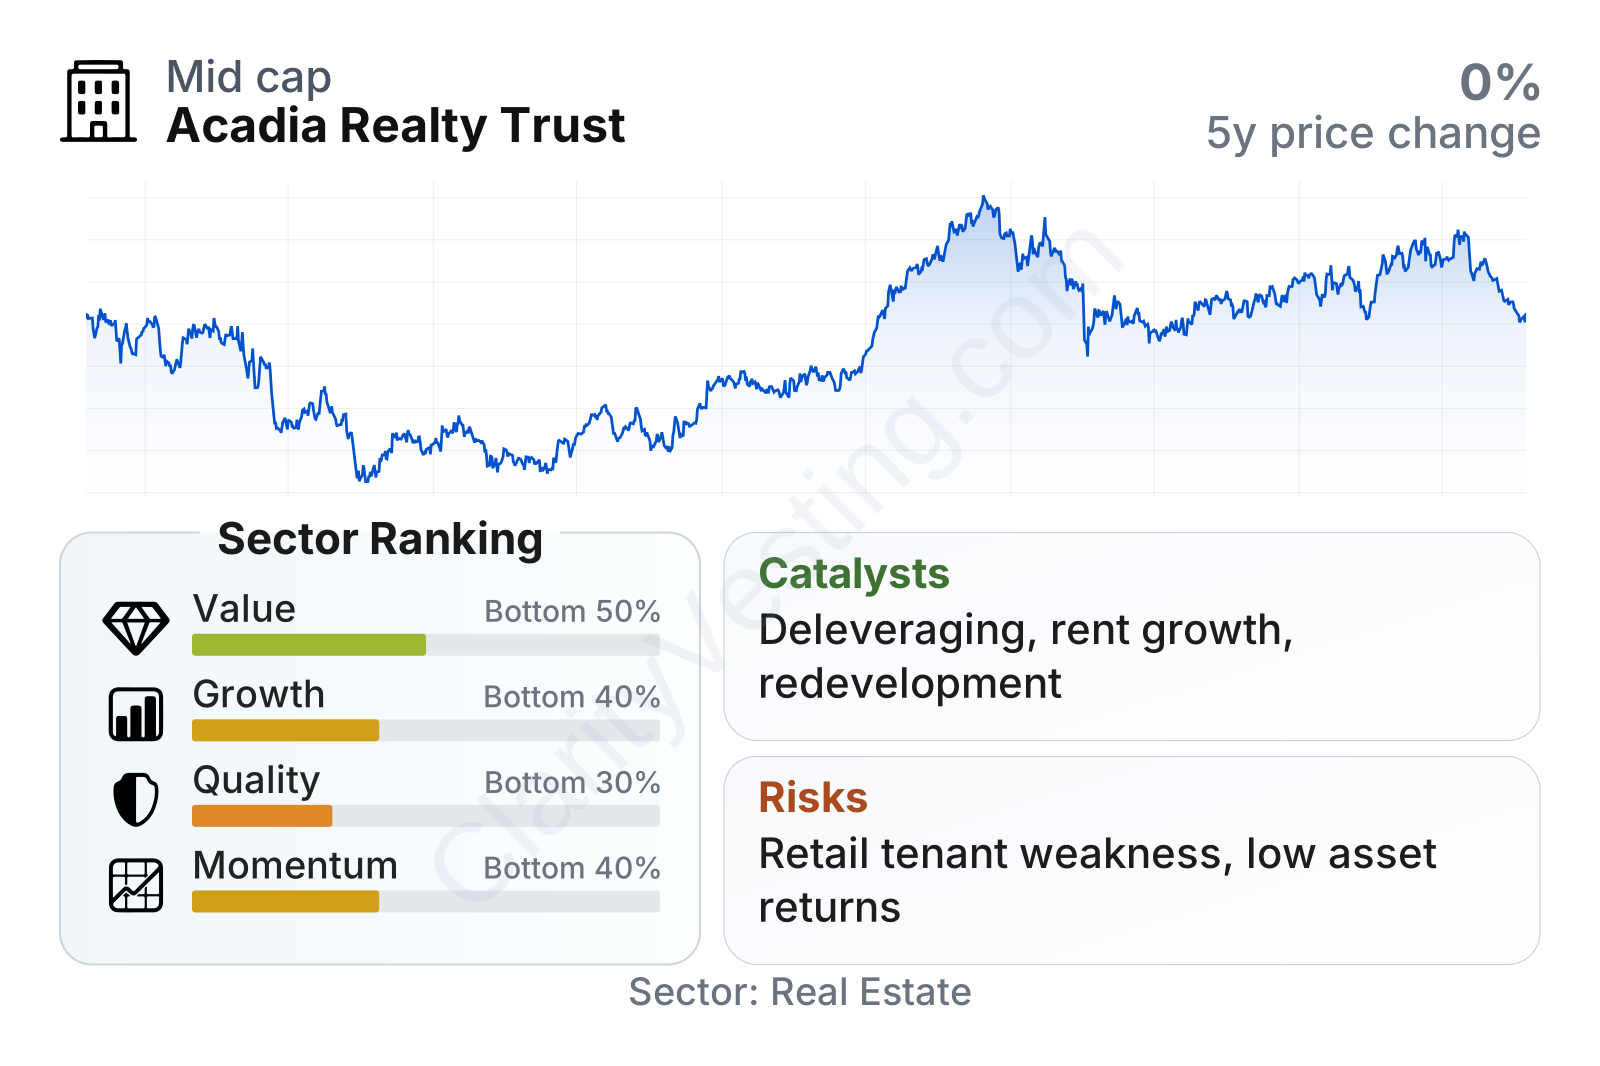
Acadia is a mid-sized retail REIT with a stock that has recovered meaningfully from its 2022 lows and has delivered a solid three-year share-price gain. Still, the latest factor profile is mixed. Revenue growth has recently been stronger than the sector median, and leverage has improved, but profitability metrics such as return on assets and return on equity remain weak relative to peers. The value profile also looks demanding in some areas, especially on earnings and free-cash-flow yield, even though operating profitability is healthy for a retail REIT.
Growth
Acadia operates in a part of real estate that has become more attractive again: open-air retail and high-street retail in supply-constrained markets. The broader retail property sector is no longer driven only by new construction. In many urban and affluent suburban locations, very little new supply is being added, which can support occupancy and rent growth for landlords that already control well-located assets. That backdrop is particularly relevant for Acadia because its strategy is not centered on commodity retail space, but on harder-to-replace locations.
The company’s strategy also makes sense for future growth. Management has focused on a mix of internal growth and external growth: raising rents as leases renew, redeveloping existing properties, upgrading the tenant base, and acquiring assets where it sees upside from leasing or repositioning. The investment management platform adds another angle, because it can broaden deal flow and create fee income without requiring all capital to come directly from Acadia’s balance sheet.
One caution is that revenue per share has not followed the same path as total revenue. After improving through 2023, it has trended lower in the last two years shown. That suggests growth has come with more shares outstanding, more assets not yet fully contributing, or a mix shift that has diluted per-share progress. For long-term analysis, this is important because per-share growth matters more than headline revenue growth.
The dividend record looks firmer. Dividend per share has increased substantially since 2021, with only a small pause in 2024 before moving higher again. The current trailing yield is around 4%, slightly below the sector median, which points to a company that is pairing income with a growth-oriented repositioning rather than maximizing yield alone.
A notable catalyst is balance-sheet improvement. Net debt to EBITDA has fallen sharply in 2026 and is now slightly better than the sector median. For a REIT, lower leverage can create room for acquisitions, redevelopment spending, and refinancing flexibility. If the company can combine that with stable occupancy and stronger leasing spreads, future cash generation could look better than recent accounting earnings suggest.
Another positive development is that the share price has remained well above the depressed levels seen in 2022 and 2023. That does not by itself create business growth, but it can make capital access easier for a REIT if management wants to pursue transactions, partnerships, or redevelopment projects.
Risks
This article is for informational purposes only and does not constitute financial advice. Some content is AI-generated. See Disclaimer


