Stock Analysis · Ashmore Group Plc (AJMPF)
Overview
Ashmore Group Plc is a specialist asset manager focused on emerging markets. In simple terms, it manages money on behalf of institutions, pension funds, sovereign wealth funds, intermediaries, and other professional clients, investing across developing economies in areas such as debt, equities, and alternative strategies. The company is listed in London, while AJMPF is the U.S. over-the-counter listing.
The business model is straightforward: Ashmore earns management fees based largely on the value of assets it oversees, and in some cases it can also earn performance-related fees. Because of that structure, revenue is closely linked to two moving parts: client inflows and outflows, and market performance in emerging-market assets.
Based on the company’s reporting structure, revenue is dominated by investment management fees, with performance fees usually representing a much smaller and more variable portion. Ashmore’s assets under management are diversified by strategy, but fixed income has historically been the largest area.
- Management fees: the main revenue source, typically representing the vast majority of income, generally around 90% to 95% in recent years. These fees come from managing client portfolios across emerging-market debt, equities, and alternatives.
- Performance fees: a smaller and more volatile source, often around 0% to 10% depending on market conditions and investment results.
- Seed capital and investment income: a limited contribution tied to the firm’s own balance-sheet investments and related items.
Within assets under management, Ashmore has been most exposed to emerging-market debt, including external debt, local currency debt, and corporate debt, with smaller contributions from equities, blended debt, and alternatives. That specialization gives the company a clear identity, but it also makes results more cyclical than those of broad global asset managers.
The operating profile remains notable. Revenue has moved down materially from 2022 to 2026, yet profitability stayed unusually strong for the sector, reflecting the light-capital nature of asset management and disciplined costs. Net debt metrics remain negative, which indicates the company holds more cash than debt.
The broad financial flow shows a business that has absorbed lower revenue without losing its high-margin structure. That resilience matters because Ashmore’s earnings power depends less on heavy capital spending and more on maintaining client assets, fees, and investment performance.
Key Figures
| Metric | Value | Sector ⓘ |
|---|---|---|
| Date | Oct 03, 2026 | |
| Context | ||
| Sector | Financial Services | |
| Industry | Asset Management | |
| Market Cap ⓘ | $1.91B | |
| Beta ⓘ | 0.97 | |
Value (Cheapness) | ||
| P/E Ratio ⓘ | 14.65 | 12.60 |
| P/B Ratio ⓘ | 2.54 | 1.23 |
| FCF Yield ⓘ | 4.74% | 10.16% |
| Dividend Yield ⓘ | 5.77% | 2.96% |
| EBIT / EV ⓘ | N/A | 7.77% |
| PEG ⓘ | N/A | |
Growth (Business expansion) | ||
| Revenue Growth ⓘ | 10.60% | 9.50% |
| RPS Growth (5Y CAGR) ⓘ | -19.39% | 12.10% |
| EPS Growth (5Y CAGR) ⓘ | N/A | -9.45% |
| BVPS Growth (5Y CAGR) ⓘ | -10.87% | 5.01% |
| Margin Growth (5Y Trend) ⓘ | 44.13% | -4.07% |
| FCF Growth (5Y CAGR) ⓘ | -28.40% | 4.96% |
| DPS Growth (5Y CAGR) ⓘ | -6.41% | 8.79% |
Quality (Business durability) | ||
| ROIC (Latest) ⓘ | 18.08% | 9.60% |
| ROE (Latest) ⓘ | 23.34% | 13.84% |
| ROA (Latest) ⓘ | 18.54% | 1.53% |
| ROIC (5Y Median) ⓘ | 10.25% | 7.86% |
| ROE (5Y Median) ⓘ | 9.87% | 12.20% |
| ROA (5Y Median) ⓘ | 8.60% | 1.29% |
| Net Debt / EBIT (Latest) ⓘ | -2.00 | 0.91 |
| Net Debt / EBIT (5Y Median) ⓘ | -3.94 | 0.74 |
| Net Debt / EBITDA (Latest) ⓘ | -1.95 | 0.97 |
| Operating Margin (Latest) ⓘ | 61.05% | 22.12% |
| Operating Margin (5Y Median) ⓘ | 68.74% | 24.39% |
| Debt to Equity (Latest) ⓘ | 2.12% | 60.37% |
| Profit Margin (Latest) ⓘ | 74.16% | 26.62% |
| Free Cash Flow (Latest) ⓘ | $90.36M | |
Momentum (Price trend) | ||
| 3Y Return ⓘ | +64.32% | +89.23% |
| 12M Return (excl. last month) ⓘ | +37.81% | +17.35% |
| 6M Return ⓘ | -0.10% | +10.00% |
| Price vs. 200-Day MA ⓘ | -0.83% | +3.73% |
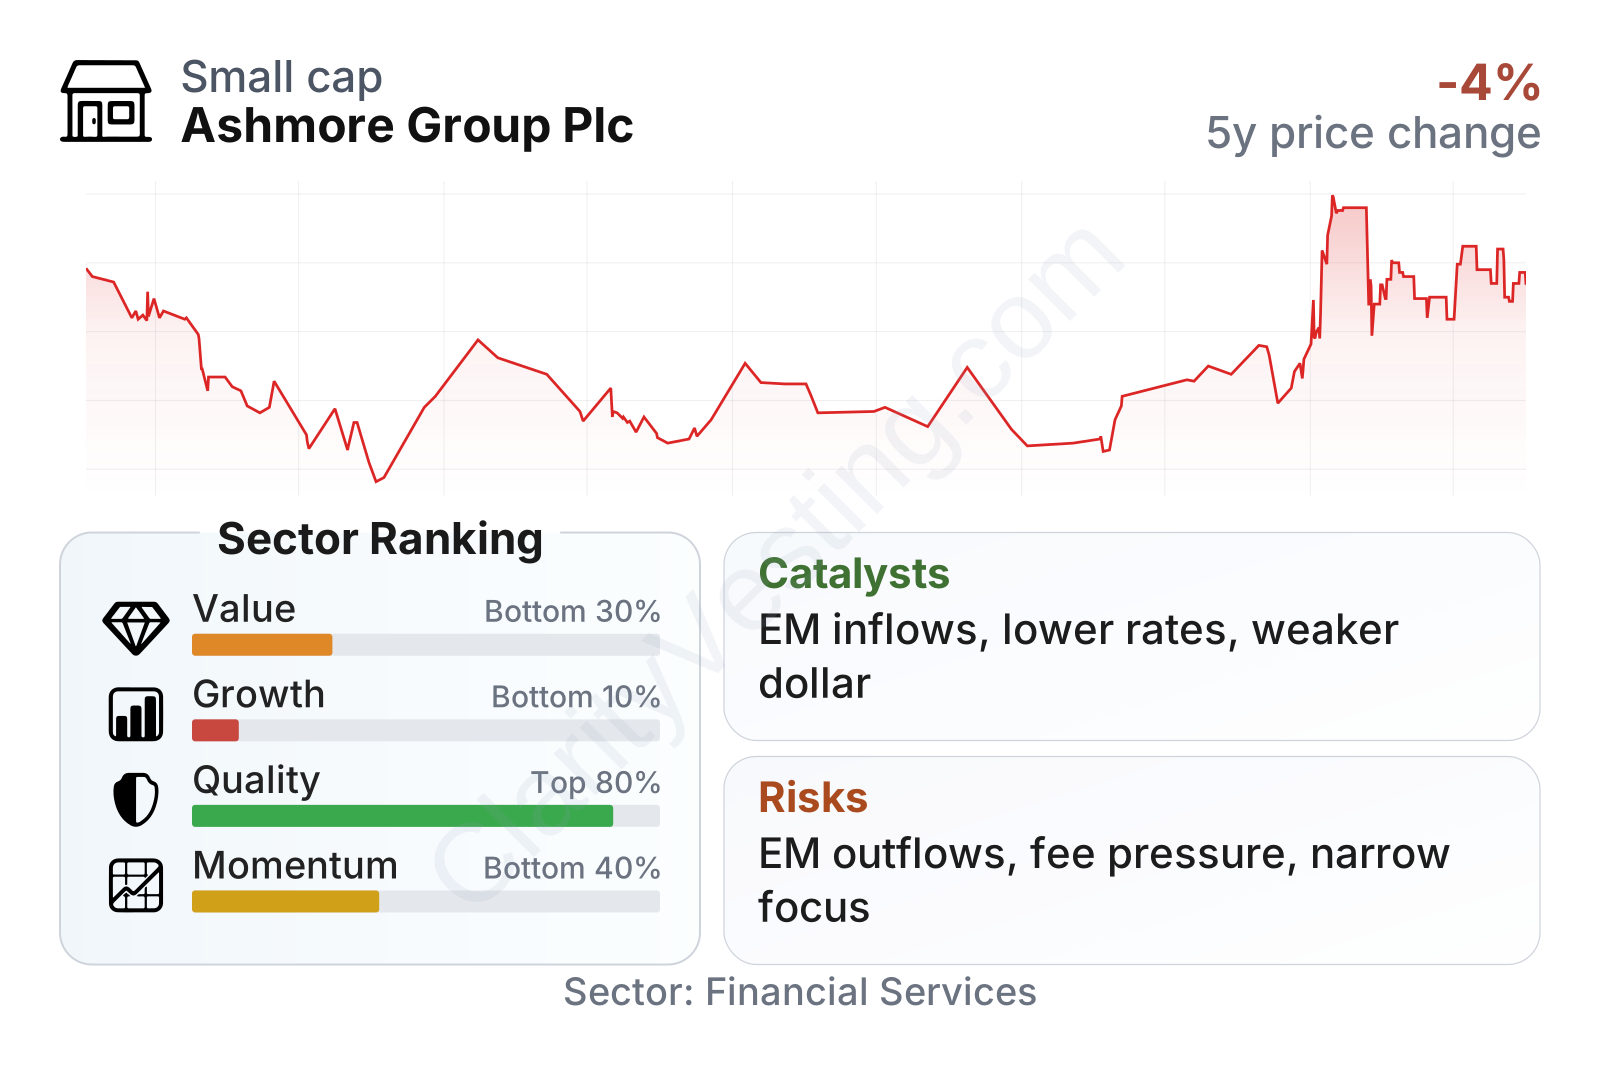
Ashmore is a mid-sized asset manager with a market value around $2 billion and share-price volatility close to the broader market. The latest metrics show a mixed profile: valuation ranks in the weaker part of the sector, growth ranks near the bottom, while quality is clearly stronger. In practical terms, the company combines high profitability, very low leverage, and a generous dividend yield with a business that has struggled to expand over a five-year period.
The stock’s trading history also shows how cyclical sentiment can be. Shares fell sharply from 2021 into late 2023, then rebounded strongly before turning more uneven in 2026. That pattern fits a company whose fortunes are tightly linked to emerging-market appetite and fee-bearing assets.
Growth
Ashmore operates in a sector with long-term potential. Emerging markets still represent a large share of global population and economic activity, and many institutional portfolios remain underallocated relative to that footprint. As global investors look for higher yields, diversification, and exposure to developing economies, specialist managers like Ashmore can benefit. That is the structural opportunity behind the company.
Its strategy also makes sense in that context. Rather than trying to be a broad financial supermarket, Ashmore stays focused on one area where it has long experience, a recognized brand, and established relationships with institutional clients. In asset management, specialization can be a real advantage when market conditions favor the niche.
Even so, the company’s recent growth record is weak. One-year revenue growth has improved, but the longer trend remains negative, with five-year declines in revenue per share, free cash flow, book value per share, and dividend per share. That suggests Ashmore has not yet translated its specialist positioning into durable expansion.
The earnings path has also been choppy rather than steadily compounding. That is common for firms tied to market levels and performance fees, but it means growth depends heavily on a sustained recovery in emerging-market asset prices and net client inflows.
Book value per share has trended lower over several years, which limits one of the usual signs of steady financial compounding. For an asset manager, this is less critical than for a bank or insurer, but it still signals that retained value creation has been under pressure.
The main catalysts are external as much as internal. Lower developed-market interest rates can support capital flows into emerging markets. A weaker U.S. dollar often helps sentiment toward developing economies. Stronger performance in emerging-market bonds and stocks can lift both assets under management and fee revenue. If Ashmore begins to post sustained net inflows again, the earnings response could be meaningful because the business already operates with high margins.
Recent company results have also shown that profitability can recover even without a full revenue rebound. That creates operating leverage: if market conditions improve further, revenue gains may translate efficiently into earnings.
Risks
This article is for informational purposes only and does not constitute financial advice. Some content is AI-generated. See Disclaimer