Stock Analysis · Arthur J Gallagher & Co (AJG)
Overview
Arthur J. Gallagher & Co. is a global insurance brokerage, risk management, and employee benefits company. In simple terms, it helps businesses, institutions, and individuals buy insurance, manage workplace benefits, and handle complex risks. Unlike an insurance carrier, Gallagher usually does not take the insurance risk onto its own balance sheet. Its main role is to advise clients, place coverage with insurers, and earn fees and commissions for doing so.
The business is built around recurring client relationships. Companies often renew insurance and benefits programs every year, which gives Gallagher a fairly steady revenue base. The group has also expanded for many years through acquisitions, adding local brokers, specialty expertise, and new client relationships across many markets.
Based on the company’s recent annual reporting structure, revenue is mainly generated from two operating segments.
- Brokerage, Risk Management and Consulting: approximately 85% to 90% of total revenue. This includes retail and wholesale property/casualty insurance brokerage, reinsurance, risk management services, claims administration, and various consulting activities.
- Employee Benefit Consulting and Brokerage: approximately 10% to 15% of total revenue. This covers health and welfare benefits, retirement-related consulting, human resources consulting, and benefits brokerage for employers.
Within those activities, the largest economic driver is generally insurance brokerage commissions and fees, followed by benefit consulting and related service fees. The revenue mix matters because brokerage businesses tend to be asset-light, cash generative, and less exposed to catastrophic underwriting losses than insurers themselves.
The financial flow over the last several years shows a business that has grown meaningfully in size, with revenue moving from a little above $8 billion in 2021 to nearly $14 billion in 2025. Operating income and net income also expanded over that period, although interest expense rose as the company funded acquisitions and growth initiatives.
The long-term pattern is favorable: revenue has climbed strongly, operating profit has improved, and the company’s scale has increased. At the same time, higher financing costs and integration expenses remain important to watch because they can limit how much of that growth reaches shareholders as net profit.
Key Figures
| Metric | Value | Sector ⓘ |
|---|---|---|
| Date | Oct 03, 2026 | |
| Context | ||
| Sector | Financial Services | |
| Industry | Insurance Brokers | |
| Market Cap ⓘ | $58.47B | |
| Beta ⓘ | 0.51 | |
Value (Cheapness) | ||
| P/E Ratio ⓘ | 37.77 | 12.60 |
| P/B Ratio ⓘ | 2.53 | 1.23 |
| FCF Yield ⓘ | 3.91% | 10.16% |
| Dividend Yield ⓘ | 1.19% | 2.96% |
| EBIT / EV ⓘ | 3.68% | 7.77% |
| PEG ⓘ | 0.71 | |
Growth (Business expansion) | ||
| Revenue Growth ⓘ | 30.90% | 9.50% |
| RPS Growth (5Y CAGR) ⓘ | 7.84% | 12.10% |
| EPS Growth (5Y CAGR) ⓘ | -1.62% | -9.45% |
| BVPS Growth (5Y CAGR) ⓘ | 21.70% | 5.01% |
| Margin Growth (5Y Trend) ⓘ | 3.58% | -4.07% |
| FCF Growth (5Y CAGR) ⓘ | 3.17% | 4.96% |
| DPS Growth (5Y CAGR) ⓘ | 7.89% | 8.79% |
Quality (Business durability) | ||
| ROIC (Latest) ⓘ | 5.72% | 9.60% |
| ROE (Latest) ⓘ | 6.70% | 13.84% |
| ROA (Latest) ⓘ | 1.95% | 1.53% |
| ROIC (5Y Median) ⓘ | 7.11% | 7.86% |
| ROE (5Y Median) ⓘ | 9.78% | 12.20% |
| ROA (5Y Median) ⓘ | 2.52% | 1.29% |
| Net Debt / EBIT (Latest) ⓘ | 0.24 | 0.91 |
| Net Debt / EBIT (5Y Median) ⓘ | 4.96 | 0.74 |
| Net Debt / EBITDA (Latest) ⓘ | 0.16 | 0.97 |
| Operating Margin (Latest) ⓘ | 16.70% | 22.12% |
| Operating Margin (5Y Median) ⓘ | 18.21% | 24.39% |
| Debt to Equity (Latest) ⓘ | 8.50% | 60.37% |
| Profit Margin (Latest) ⓘ | 10.38% | 26.62% |
| Free Cash Flow (Latest) ⓘ | $2.29B | |
Momentum (Price trend) | ||
| 3Y Return ⓘ | +6.10% | +89.23% |
| 12M Return (excl. last month) ⓘ | -12.49% | +17.35% |
| 6M Return ⓘ | +7.81% | +10.00% |
| Price vs. 200-Day MA ⓘ | -0.02% | +3.73% |
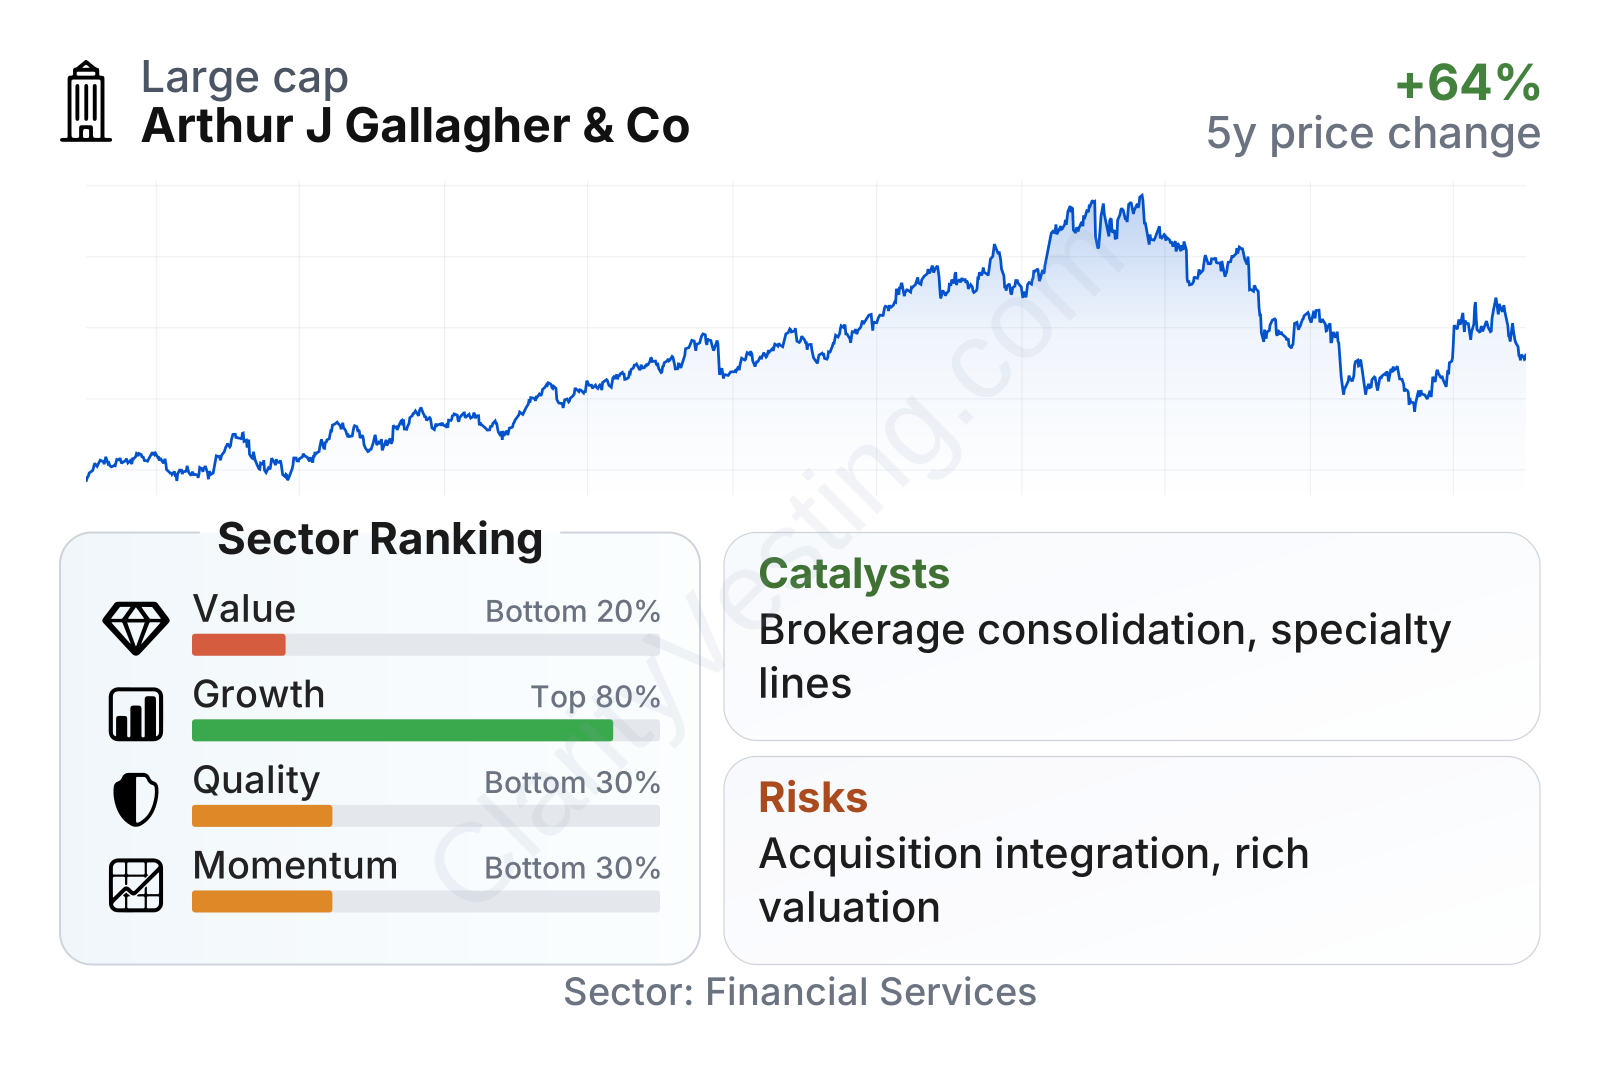
Gallagher is a very large company in the insurance brokerage industry, and its stock has historically shown lower volatility than the broader market, with a beta around 0.5. The share price had a strong multiyear climb through 2024 and into parts of 2025, followed by a meaningful pullback and partial recovery in 2026. That creates a more mixed short-term picture than the company’s longer-term operating trend.
The factor table points to a business with stronger growth than much of the sector, but with a rich valuation. Revenue growth is running well above the sector median, and operating margin trend over five years has improved even though absolute margins remain below sector medians. Quality metrics are mixed: leverage is currently modest, but return on equity and return on invested capital are below many peers. Momentum also looks softer than much of the sector after the recent correction.
Growth
Gallagher operates in a sector that has attractive long-term characteristics. Insurance and employee benefits are not optional for most commercial clients, and the complexity of risks keeps increasing. Rising cyber threats, stricter regulation, more severe weather events, healthcare cost pressure, and multinational insurance needs all support demand for expert intermediaries. That backdrop tends to favor scaled brokers with specialist capabilities.
The company’s strategy is also easy to understand. It grows in three ways: by retaining clients, by expanding services to existing accounts, and by acquiring other brokers and advisory firms. This model has made sense for many years because the brokerage market remains fragmented in many niches and geographies. Scale helps Gallagher negotiate with insurers, spread technology and compliance costs, and offer specialized expertise that smaller firms may struggle to match.
Earnings per share have moved upward over the last several years, showing a clear longer-term expansion path even if growth has not been perfectly smooth from one period to the next.
Book value per share also rose sharply over time, especially after recent years of acquisition-led expansion and retained earnings growth. That indicates the company has been adding to its capital base while building a larger operating platform.
One of the clearest growth catalysts is continued consolidation in insurance brokerage. Gallagher has a long record of buying smaller firms and integrating them into its network. Another catalyst is exposure to specialty insurance lines and consulting services, where pricing and advisory complexity can support better fee generation than plain-vanilla brokerage. Employee benefits also remains a useful second leg of growth as employers continue outsourcing plan design and administration work.
Recent company communications and filings have continued to emphasize acquisitions, international expansion, and demand for specialty capabilities. In a market where commercial insurance pricing has generally stayed supportive in many lines, brokers like Gallagher can benefit because commissions often move with premium volumes. That does not guarantee faster growth every year, but it does create a tailwind when exposure values and premium rates rise together.
Risks
This article is for informational purposes only and does not constitute financial advice. Some content is AI-generated. See Disclaimer


