Stock Analysis · Ameren Illinois Company (AILLM)
Overview
Ameren Illinois Company is a regulated utility that delivers electricity and natural gas in Illinois. It does not operate like a typical competitive business that must win customers every year on price. Instead, it serves defined service territories under state regulation, earning returns that are largely tied to the infrastructure it owns and operates. That makes the business easier to understand than many industrial or technology companies: it invests in poles, wires, substations, pipelines, and related systems, then seeks to recover those costs through regulated rates.
The company’s revenue mainly comes from energy delivery rather than from fast-changing discretionary demand. Based on public filings from its parent group and segment disclosures, the business is centered on two main activities:
- Electric distribution and transmission: approximately 65% to 75% of revenue. This includes delivering electricity to homes, businesses, and public-sector customers, plus transmission-related revenue linked to the high-voltage grid.
- Natural gas distribution: approximately 25% to 35% of revenue. This includes delivering natural gas to residential, commercial, and industrial customers across its Illinois territory.
Because it is a regulated utility, revenue can move not only with customer demand and weather, but also with approved rate changes, rider mechanisms, and investment recovery. That usually creates steadier economics than in most sectors, although it also means growth is typically gradual and policy-dependent.
Over the last several years, revenue has trended upward overall, operating income has improved, and net income has generally expanded as the utility base has grown. One notable point is that interest expense has also increased, which is common for utilities because grid modernization requires heavy capital spending and debt financing. Even so, operating profitability has remained solid.
The business mix shows a utility with rising revenue and operating income over time, while financing costs have also climbed. That pattern is typical of a company investing heavily in long-lived infrastructure: stronger earnings from a larger asset base can coexist with weaker cash flow in the short term.
Key Figures
| Metric | Value | Sector ⓘ |
|---|---|---|
| Date | Oct 17, 2026 | |
| Context | ||
| Sector | Utilities | |
| Industry | Utilities - Regulated Electric | |
| Market Cap ⓘ | $2.03B | |
| Beta ⓘ | N/A | |
Value (Cheapness) | ||
| P/E Ratio ⓘ | 4.50 | 17.28 |
| P/B Ratio ⓘ | 2.74 | 1.51 |
| FCF Yield ⓘ | -57.99% | 0.65% |
| Dividend Yield ⓘ | N/A | 3.77% |
| EBIT / EV ⓘ | 21.62% | 5.01% |
| PEG ⓘ | N/A | |
Growth (Business expansion) | ||
| Revenue Growth ⓘ | 10.30% | 6.10% |
| RPS Growth (5Y CAGR) ⓘ | -40.61% | 3.87% |
| EPS Growth (5Y CAGR) ⓘ | -14.39% | -11.30% |
| BVPS Growth (5Y CAGR) ⓘ | -39.92% | 4.23% |
| Margin Growth (5Y Trend) ⓘ | 4.94% | 3.57% |
| FCF Growth (5Y CAGR) ⓘ | N/A | -8.84% |
| DPS Growth (5Y CAGR) ⓘ | 88.05% | 4.84% |
Quality (Business durability) | ||
| ROIC (Latest) ⓘ | N/A | 6.53% |
| ROA (Latest) ⓘ | 8.19% | 3.20% |
| ROIC (5Y Median) ⓘ | 6.25% | 5.95% |
| ROA (5Y Median) ⓘ | 3.33% | 2.75% |
| Net Debt / EBIT (Latest) ⓘ | 0.16 | 7.13 |
| Net Debt / EBIT (5Y Median) ⓘ | 5.66 | 7.23 |
| Net Debt / EBITDA (Latest) ⓘ | 0.11 | 4.31 |
| Net Debt / Assets ⓘ | 1.43% | 38.42% |
| EBITDA / Interest ⓘ | 6.81 | 4.58 |
| Operating Margin (Latest) ⓘ | 32.66% | 20.83% |
| Operating Margin (5Y Median) ⓘ | 29.92% | 20.08% |
| Debt to Equity (Latest) ⓘ | 3.91% | 137.69% |
| Profit Margin (Latest) ⓘ | 19.74% | 11.37% |
| Free Cash Flow (Latest) ⓘ | -$1.18B | |
Momentum (Price trend) | ||
| 3Y Return ⓘ | +18.28% | +52.37% |
| 12M Return (excl. last month) ⓘ | +3.86% | +8.84% |
| 6M Return ⓘ | -1.97% | -3.95% |
| Price vs. 200-Day MA ⓘ | +4.60% | -0.79% |
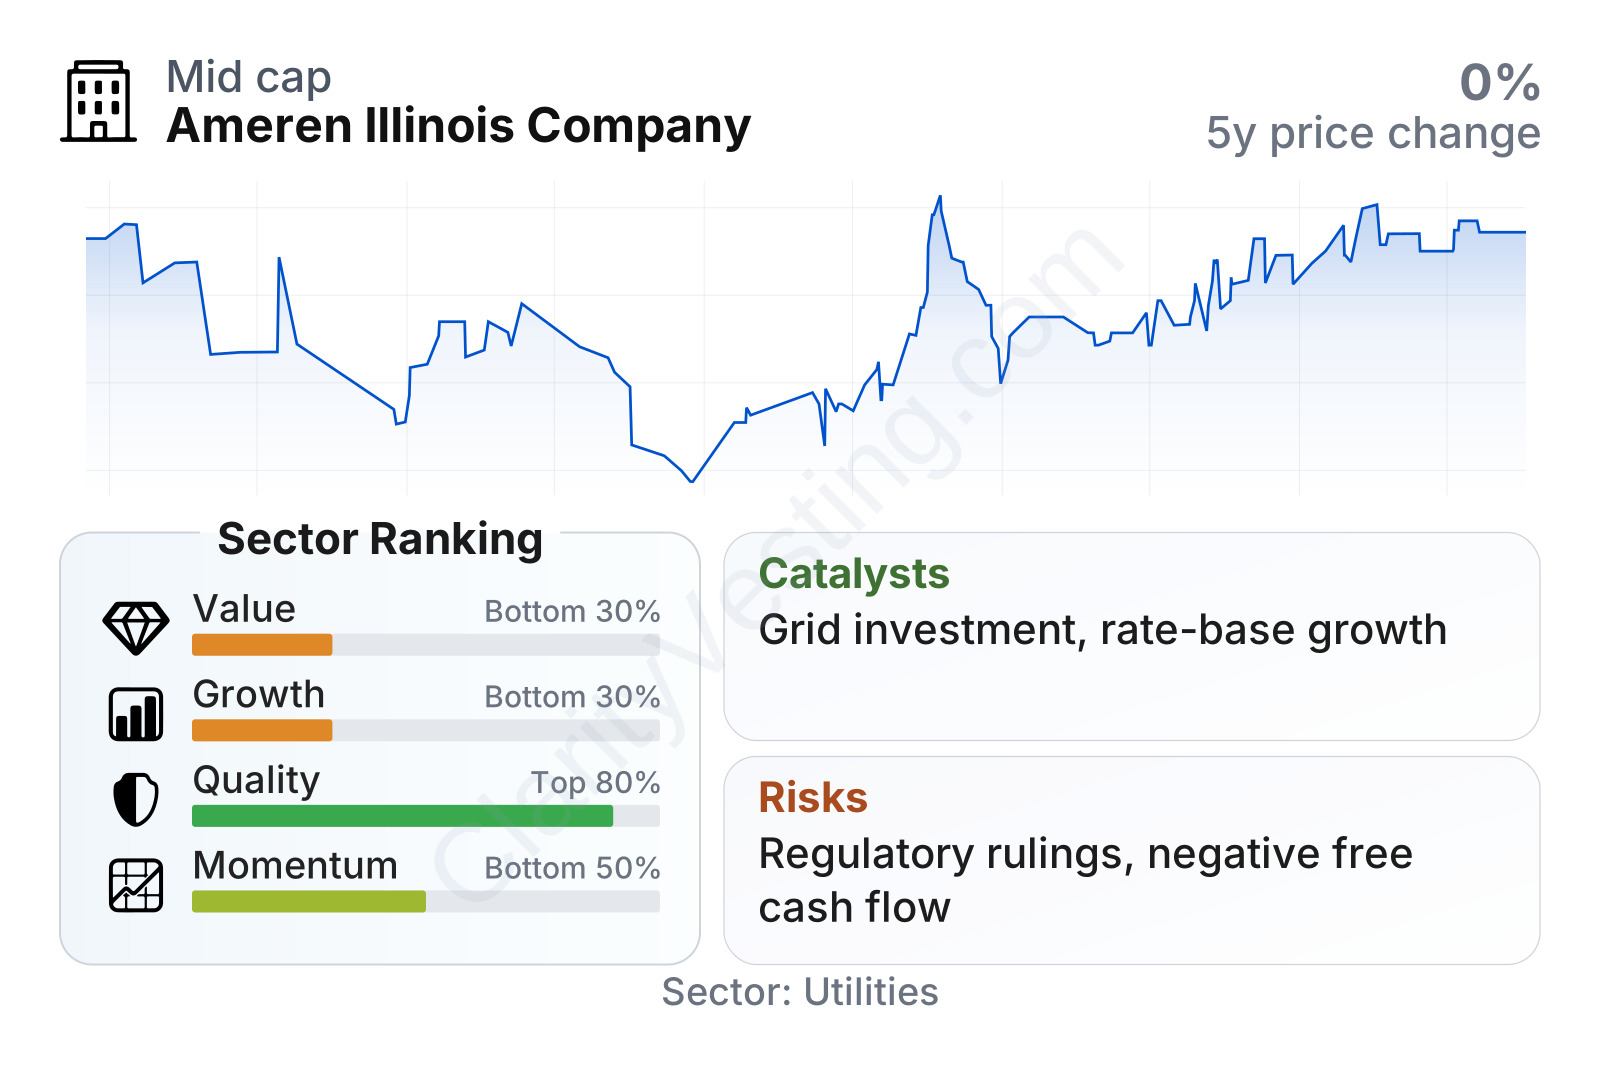
Ameren Illinois appears to combine strong operating quality with weaker headline value and growth scores. Profitability stands well above many utility peers, with operating margin around the low-30% range and profit margin near 20%, both stronger than sector medians. Balance-sheet indicators also look unusually conservative for a utility, including low debt relative to equity and solid interest coverage.
At the same time, free cash flow is deeply negative, which is important for context. In utilities, negative free cash flow often reflects large infrastructure programs rather than a weak core business, but it still means the company depends on external financing and regulatory recovery to support expansion. Share-price performance has been relatively muted over multi-year periods, fitting the profile of a slower-moving regulated business rather than a market favorite.
Growth
The regulated utility sector is not a high-growth arena, but it is in a part of the economy with durable long-term relevance. Electricity demand is becoming more important as data centers, industrial electrification, electric vehicles, and grid resilience needs expand. Natural gas distribution remains a mature business, yet it still supports stable demand in many service areas. For Ameren Illinois, the central growth driver is not rapid customer expansion; it is the ability to invest in the grid and earn approved returns on a larger regulated asset base.
That strategy makes industrial sense. Utilities often create value over long periods by upgrading aging networks, improving reliability, hardening systems against storms, and connecting new loads. If regulators continue allowing timely recovery on those investments, earnings can rise steadily even when customer usage grows only modestly.
The longer-term revenue-per-share picture is somewhat distorted by changes in share count or reporting context, so the sharp drop in the later points should not be read on its own as a collapse in the operating business. More useful signals are the broader revenue trend, the steady improvement in operating income, and the company’s ability to maintain above-sector margins while investing.
A recent positive element is that year-over-year revenue growth is ahead of the sector median. That does not turn the company into a fast grower, but it does suggest current momentum in the regulated business is better than what a purely defensive label might imply. The broader industry backdrop also remains supportive as utilities across the country expand transmission and distribution systems to meet reliability and electrification needs.
Another potential catalyst is the continued need for infrastructure replacement in Illinois. For a utility, aging networks are not only a maintenance challenge; they are also a framework for future regulated capital deployment. When executed well, that can support a long runway of investment and earnings visibility.
Risks
This article is for informational purposes only and does not constitute financial advice. Some content is AI-generated. See Disclaimer


