Stock Analysis · Absa Group Limited (AGRPF)
Overview
Absa Group Limited is a large African banking group headquartered in South Africa. It provides everyday banking, lending, payments, savings, insurance, wealth services, and corporate and investment banking to retail customers, businesses, institutions, and governments. Its footprint is centered on South Africa, with additional operations in markets such as Ghana, Kenya, Mauritius, Mozambique, Seychelles, Tanzania, Uganda, and Zambia.
Like most banks, Absa makes money primarily from the spread between the interest it earns on loans and the interest it pays on deposits and funding, then adds fee income from transactions and advisory activities. Based on its recent annual reporting structure, the business is organized mainly across the following revenue-generating activities:
- Everyday banking / Personal and Private Banking: the largest contributor, including home loans, vehicle finance, credit cards, deposits, payments, and transactional banking for households and affluent clients.
- Business banking: banking services for small and mid-sized companies, including lending, cash management, merchant acquiring, and working-capital products.
- Corporate and Investment Banking: lending, trade finance, treasury, markets, investment banking, and risk-management solutions for large companies and institutions.
- Insurance and wealth: life and non-life insurance, asset management, and related products sold through the banking network and specialist channels.
- Regional operations outside South Africa: these are not a separate product line in every disclosure, but they remain an important source of diversification and customer growth across the continent.
Exact percentages can vary from year to year depending on interest rates, trading conditions, and regional performance. In practice, South Africa remains the core earnings base, while corporate banking and retail banking are the largest business engines. Insurance and wealth add a smaller but strategically useful stream of fee-based income.
One notable pattern in recent years is that reported revenue and profit have generally moved upward, while operating income has also improved. That points to a bank that is still expanding its earning base even though accounting presentation in banks can make some line items look unusual from one year to the next.
Key Figures
| Metric | Value | Sector ⓘ |
|---|---|---|
| Date | Oct 10, 2026 | |
| Context | ||
| Sector | Financial Services | |
| Industry | Banks - Regional | |
| Market Cap ⓘ | $6.72B | |
| Beta ⓘ | 0.35 | |
Value (Cheapness) | ||
| P/E Ratio ⓘ | 6.65 | 12.38 |
| P/B Ratio ⓘ | 0.00 | 1.23 |
| FCF Yield ⓘ | 94.07% | 10.23% |
| Dividend Yield ⓘ | 9.14% | 3.01% |
| EBIT / EV ⓘ | N/A | 8.08% |
| PEG ⓘ | N/A | |
Growth (Business expansion) | ||
| Revenue Growth ⓘ | 4.80% | 9.50% |
| RPS Growth (5Y CAGR) ⓘ | 158.75% | 12.21% |
| EPS Growth (5Y CAGR) ⓘ | -33.74% | -9.62% |
| BVPS Growth (5Y CAGR) ⓘ | 110.47% | 4.98% |
| Margin Growth (5Y Trend) ⓘ | -18.09% | -4.07% |
| FCF Growth (5Y CAGR) ⓘ | 137.32% | 4.76% |
| DPS Growth (5Y CAGR) ⓘ | 184.00% | 8.79% |
Quality (Business durability) | ||
| ROIC (Latest) ⓘ | 5.65% | 9.35% |
| ROE (Latest) ⓘ | 30.67% | 13.91% |
| ROA (Latest) ⓘ | 2.26% | 1.53% |
| ROIC (5Y Median) ⓘ | 6.35% | 7.86% |
| ROE (5Y Median) ⓘ | 14.61% | 12.22% |
| ROA (5Y Median) ⓘ | 1.15% | 1.29% |
| Net Debt / EBIT (Latest) ⓘ | 10.14 | 0.99 |
| Net Debt / EBIT (5Y Median) ⓘ | 5.43 | 0.73 |
| Net Debt / EBITDA (Latest) ⓘ | 7.57 | 0.93 |
| Operating Margin (Latest) ⓘ | 9.75% | 22.19% |
| Operating Margin (5Y Median) ⓘ | 30.03% | 24.30% |
| Debt to Equity (Latest) ⓘ | 272.97% | 60.24% |
| Profit Margin (Latest) ⓘ | 22.53% | 26.49% |
| Free Cash Flow (Latest) ⓘ | $6.32B | |
Momentum (Price trend) | ||
| 3Y Return ⓘ | +21.81% | +88.52% |
| 12M Return (excl. last month) ⓘ | +13.13% | +19.65% |
| 6M Return ⓘ | +14.30% | +6.00% |
| Price vs. 200-Day MA ⓘ | +9.34% | +3.61% |
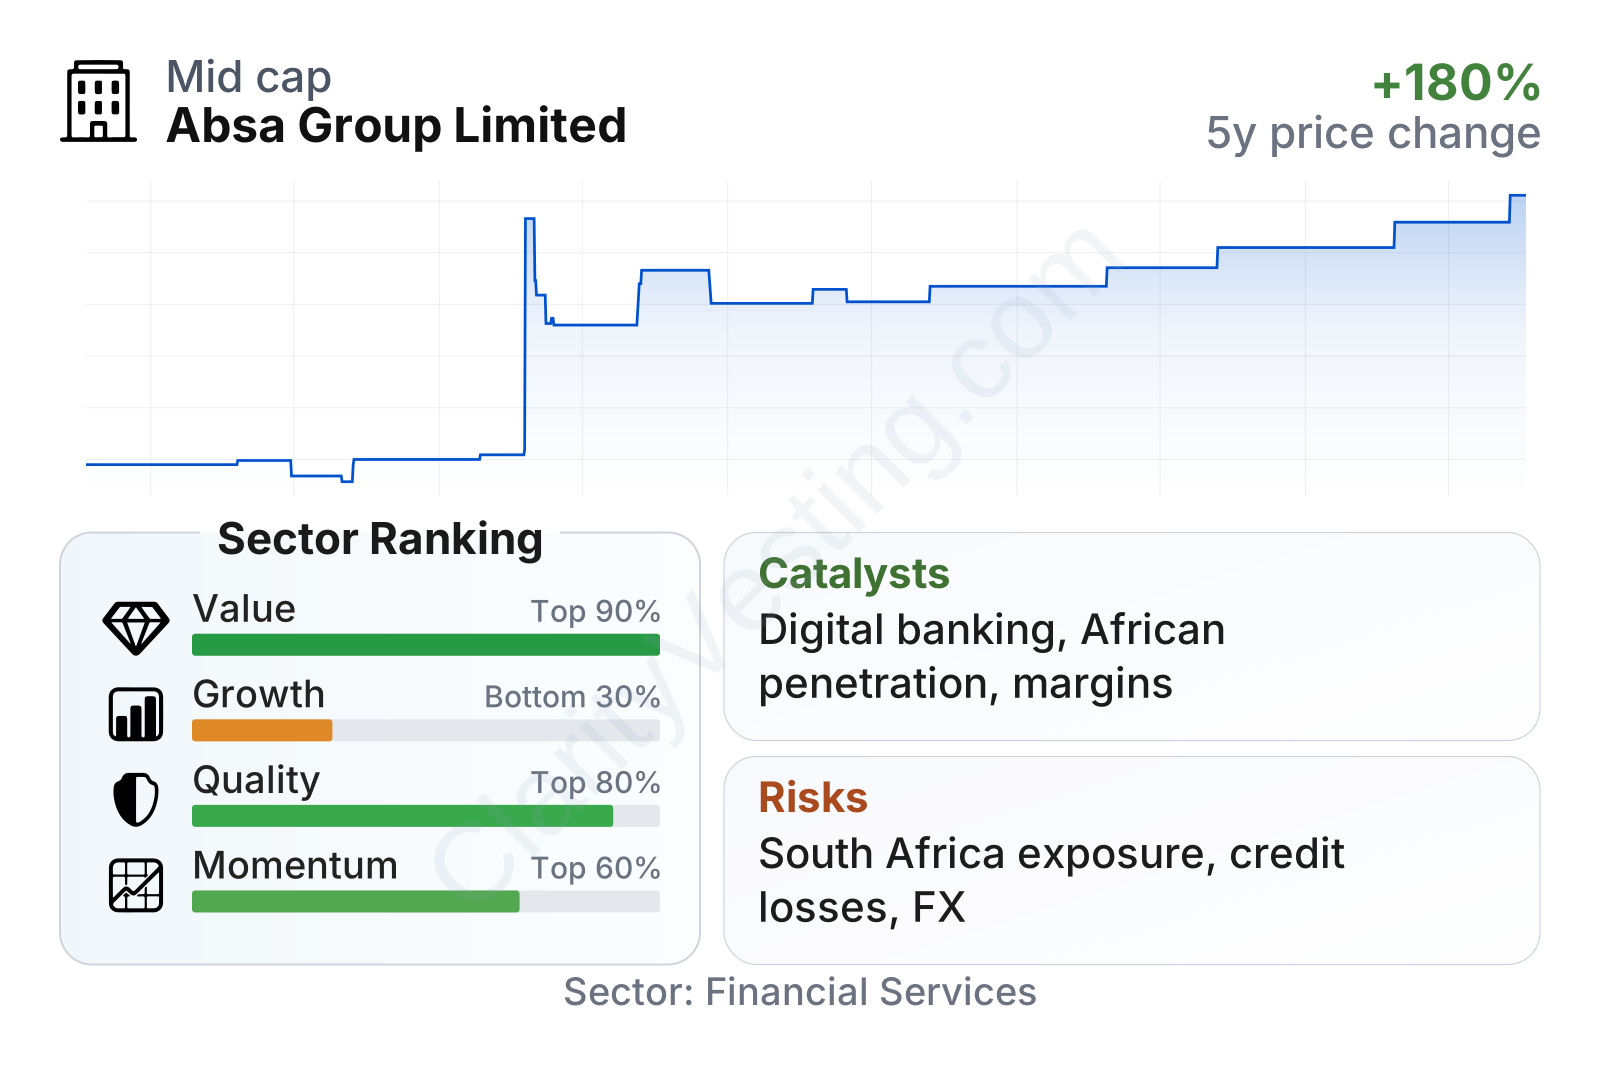
Absa sits in the mid-sized range by market value and shows a relatively low beta, meaning its share price has historically moved less than many stocks. The valuation profile stands out immediately: its earnings multiple is well below the sector median, and its dividend yield is substantially above the sector median. On profitability, return on equity is strong at roughly 31%, clearly ahead of the typical regional bank in the broader sector sample, while return on assets is also above median.
The mixed part is growth and balance-sheet interpretation. Recent revenue growth of about 5% trails the sector median, and the longer-term earnings trend has been uneven. At the same time, book value per share and dividend growth over five years look exceptionally strong. Leverage ratios appear very high versus the broad sector sample, but that comparison should be treated carefully because banks naturally operate with far more balance-sheet leverage than many other financial businesses.
The stock chart shows that the share price has recovered strongly since 2022 and has continued to trend upward into 2026, although over a full three-year period the gain still lags the broader sector median. In short, the market has recognized improving fundamentals, but Absa is still priced more conservatively than many peers.
Growth
Absa operates in African banking, a sector that still has structural room to expand over the long term. Several countries in its footprint continue to offer growth in population, urbanization, digital payments, formal savings, consumer credit, and banking penetration. Those are favorable background drivers because they can support loan growth, transaction volumes, and broader use of financial products over time.
The company’s strategy also makes sense in that context. Absa has been investing in digital channels, payments, customer acquisition, and product depth across retail, business, and corporate banking. For a bank, that matters because stronger digital adoption can improve customer retention, increase transaction income, and lower service costs over time. Its mix of South African scale and regional presence gives it both a large home market and optionality in faster-growing African markets.
Another supportive element is capital compounding. Book value per share has trended upward over time, which is important for banks because book value often reflects the growth of the underlying balance sheet and retained earnings capacity.
There are also a few practical catalysts that can matter over the next several years. If interest margins remain supportive, Absa can continue to translate its deposit franchise into earnings. If credit losses stay under control, profit growth can outpace revenue growth. And if management keeps improving efficiency while expanding digital usage, returns could remain healthy even in a slower economic backdrop.
Recent company reporting has also highlighted continued shareholder distributions and solid profitability, suggesting that the franchise is producing enough earnings to fund both operations and capital returns. That does not remove cyclicality, but it does indicate operating resilience.
Risks
This article is for informational purposes only and does not constitute financial advice. Some content is AI-generated. See Disclaimer