Stock Analysis · Federal Agricultural Mortgage Corporation (AGM)
Overview
Federal Agricultural Mortgage Corporation, better known as Farmer Mac, is a federally chartered company that supports financing in rural America. Instead of operating like a traditional consumer bank, it provides liquidity to agricultural and rural lenders. In practical terms, it buys eligible loans, guarantees securities backed by those loans, and holds a portfolio of agricultural, rural utility, broadband, renewable energy, and infrastructure credit exposures. Its role is to help banks, credit unions, farm credit institutions, and other lenders free up capital so they can make more loans.
The business is tied to areas that are essential but often overlooked in mainstream finance: farm real estate, agricultural production, rural housing, utilities, communications, and certain institutional investments. That gives Farmer Mac a specialized niche with policy relevance and relatively limited direct competition in exactly the same form.
Based on recent company reporting, Farmer Mac’s revenue mix is dominated by net interest income, with a smaller contribution from guarantee and commitment fees and a modest amount from other income sources. A simple way to think about the business is that most revenue comes from the spread between what it earns on loans and investments and what it pays to fund them.
- Net interest income: approximately 85% to 90% of total revenue. This includes interest earned on loans, guarantees, and retained portfolio assets, minus interest paid on debt funding.
- Guarantee and commitment fees: approximately 8% to 12%. These fees come from guaranteeing securities and maintaining standby commitments that support lenders and borrowers.
- Other income: approximately 1% to 5%. This can include prepayment-related items, gains or losses, and smaller ancillary sources.
Over the last several years, total revenue expanded sharply, but the business model also carries very large interest expense because Farmer Mac relies heavily on debt funding. What matters most is not gross revenue alone, but how well the company protects its spread, credit quality, and capital while growing its portfolio.
The long-term pattern shows a much larger revenue base than a few years ago, but also a business that is highly sensitive to funding costs. Net income has remained comparatively steady even while total revenue and interest expense moved around more dramatically, which suggests a degree of resilience in earnings but also highlights how important balance-sheet management is.
Key Figures
| Metric | Value | Sector ⓘ |
|---|---|---|
| Date | Oct 24, 2026 | |
| Context | ||
| Sector | Financial Services | |
| Industry | Credit Services | |
| Market Cap ⓘ | $2.16B | |
| Beta ⓘ | 1.07 | |
Value (Cheapness) | ||
| P/E Ratio ⓘ | 10.91 | 12.46 |
| P/B Ratio ⓘ | 1.18 | 1.25 |
| FCF Yield ⓘ | 14.32% | 9.82% |
| Dividend Yield ⓘ | 3.09% | 2.94% |
| EBIT / EV ⓘ | N/A | 8.11% |
| PEG ⓘ | 0.72 | |
Growth (Business expansion) | ||
| Revenue Growth ⓘ | 24.90% | 9.10% |
| RPS Growth (5Y CAGR) ⓘ | 30.59% | 12.31% |
| EPS Growth (5Y CAGR) ⓘ | -3.14% | -6.97% |
| BVPS Growth (5Y CAGR) ⓘ | 23.52% | 5.02% |
| Margin Growth (5Y Trend) ⓘ | -29.55% | -4.00% |
| FCF Growth (5Y CAGR) ⓘ | -34.55% | 4.71% |
| DPS Growth (5Y CAGR) ⓘ | 9.43% | 8.92% |
Quality (Business durability) | ||
| ROIC (Latest) ⓘ | N/A | 9.18% |
| ROE (Latest) ⓘ | 12.16% | 13.93% |
| ROA (Latest) ⓘ | 0.63% | 1.57% |
| ROIC (5Y Median) ⓘ | 0.56% | 7.80% |
| ROE (5Y Median) ⓘ | 15.72% | 12.15% |
| ROA (5Y Median) ⓘ | 0.68% | 1.28% |
| Net Debt / EBIT (Latest) ⓘ | N/A | 1.02 |
| Net Debt / EBIT (5Y Median) ⓘ | 132.12 | 0.72 |
| Net Debt / EBITDA (Latest) ⓘ | 120.00 | 0.88 |
| Operating Margin (Latest) ⓘ | N/A | 22.30% |
| Operating Margin (5Y Median) ⓘ | 29.89% | 24.50% |
| Debt to Equity (Latest) ⓘ | 1870.86% | 59.34% |
| Profit Margin (Latest) ⓘ | 56.03% | 26.42% |
| Free Cash Flow (Latest) ⓘ | $310.06M | |
Momentum (Price trend) | ||
| 3Y Return ⓘ | +54.49% | +95.73% |
| 12M Return (excl. last month) ⓘ | +25.43% | +17.30% |
| 6M Return ⓘ | +17.96% | +6.07% |
| Price vs. 200-Day MA ⓘ | +8.52% | +5.36% |
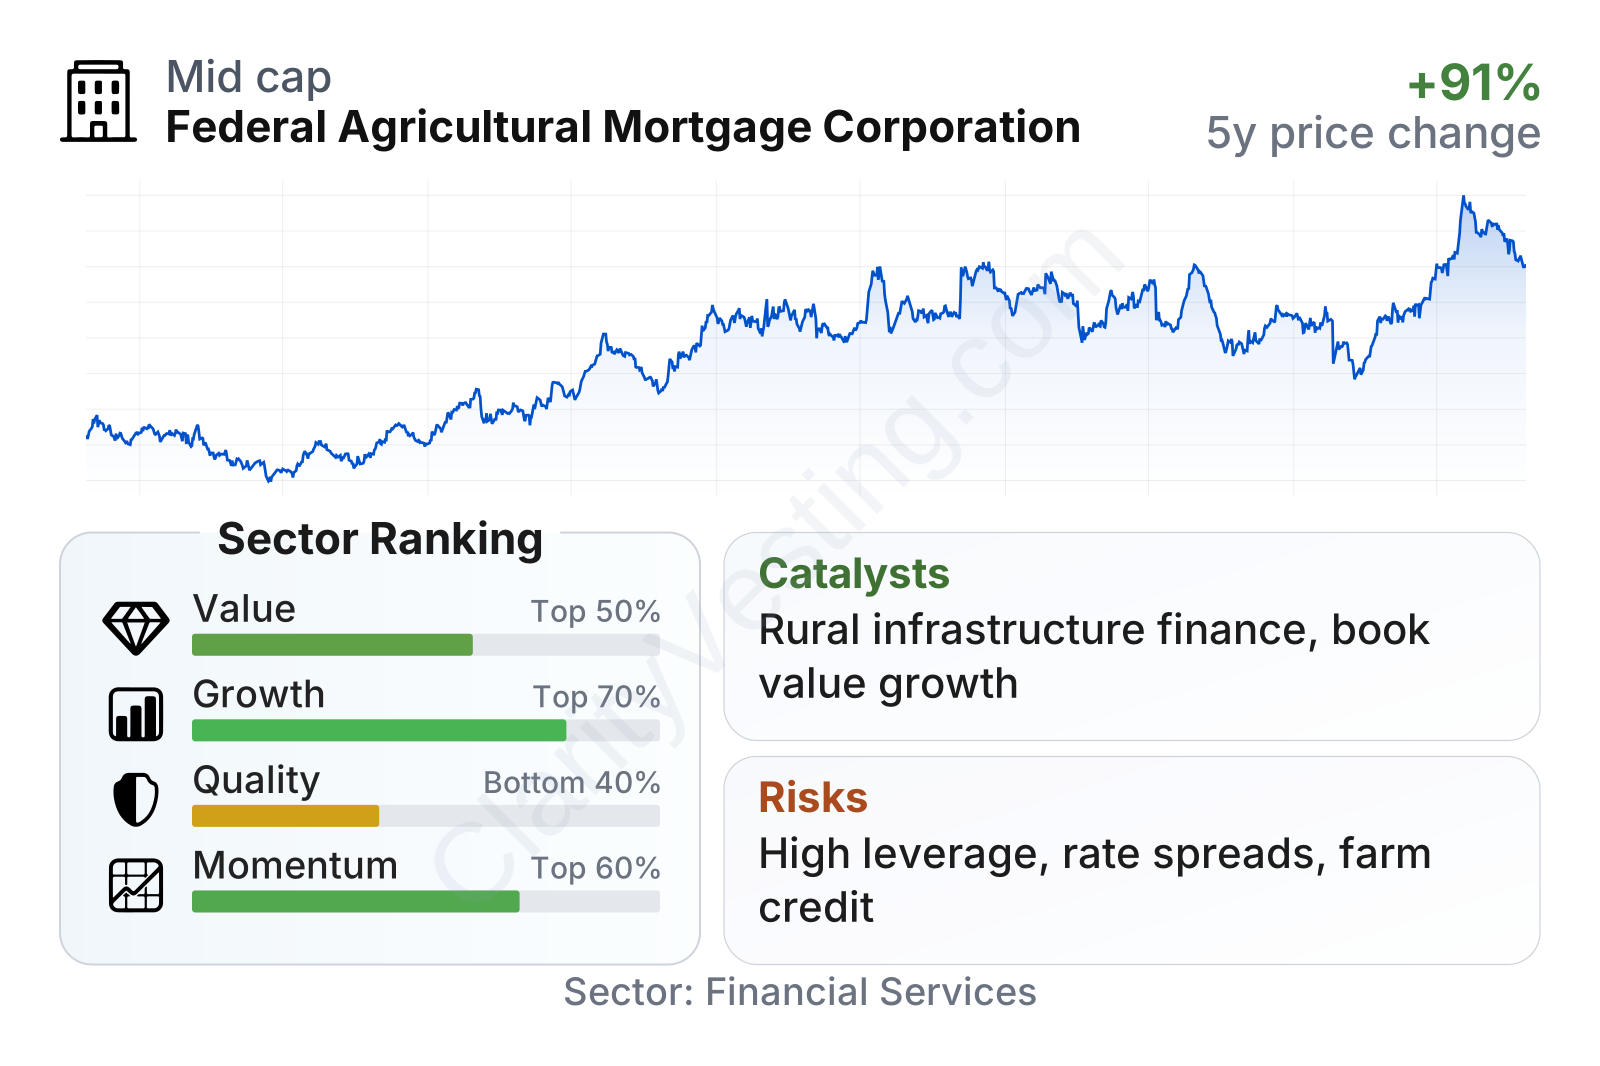
Farmer Mac is a mid-sized financial company with market value in the low single-digit billions and a share-price pattern that has been volatile but broadly upward over several years. The overall metrics point to a mixed profile: growth indicators are stronger than much of the financial sector, value metrics are around sector norms, and profitability is solid in some areas but weaker in asset efficiency. That combination fits a leveraged specialty lender rather than a conventional high-return compounder.
The latest factor summary is especially useful because it shows why the company can look attractive and complicated at the same time. Revenue growth, book value growth, and dividend growth compare well with many peers, but quality measures are less impressive because returns on assets are structurally low and leverage is very high, which is common in finance but still important to watch carefully.
Growth
Farmer Mac operates in a sector with steady structural demand rather than explosive expansion. Agriculture, rural infrastructure, electric cooperatives, broadband deployment, and renewable energy financing are all areas that continue to need long-term capital. In that sense, the company participates in markets with durable importance. The growth case is less about rapid disruption and more about deepening a specialized financing role in markets that remain underpenetrated by larger institutions.
Its strategy appears coherent for that environment. The company keeps building around secondary-market solutions, securitization, guarantees, and a retained portfolio that serves rural credit needs across multiple categories. This broadening beyond traditional farm mortgages matters because it reduces dependence on any single product line and gives Farmer Mac exposure to themes such as rural broadband, utility systems, and energy-related infrastructure.
The earnings trend has generally moved in the right direction over the last several years, even if not in a perfectly smooth line. Earnings per share rose strongly from 2021 through 2025, showing that management has been able to scale the platform and preserve profitability through a changing rate environment.
The earnings chart shows a business that has materially improved its profit base since 2021. Even if short-term periods flatten or fluctuate, the broader direction suggests that Farmer Mac has been able to translate portfolio expansion into higher per-share results over time.
Book value per share has also increased sharply, which is particularly relevant for a balance-sheet-driven financial company. When book value compounds well, it usually signals that retained earnings and capital management are supporting future capacity.
The increase in book value per share has been especially strong compared with much of the sector over the last five years. That is one of the more constructive signs in the company’s profile because it indicates that balance-sheet growth has not come at the expense of capital accumulation.
A notable catalyst is public and private investment in rural America. Programs and spending related to broadband access, grid modernization, renewable energy, and community infrastructure can enlarge the addressable market for financing partners like Farmer Mac. Another catalyst is the company’s established charter and market position, which can help it capture business when lenders want liquidity solutions without building those capabilities themselves.
Recent company communications have also emphasized continued business volume across core agricultural finance and rural infrastructure channels. That does not guarantee faster profit growth every year, but it supports the idea that Farmer Mac is still finding demand in its niche rather than merely defending a mature book.
Risks
This article is for informational purposes only and does not constitute financial advice. Some content is AI-generated. See Disclaimer


