Stock Analysis · AGL Energy Ltd (AGLXY)
Overview
AGL Energy Ltd is one of Australia’s largest integrated energy companies. It sells electricity and gas to residential, small business, and large commercial customers, and it also owns and operates power generation assets. In practical terms, AGL sits across much of the energy value chain: it buys and produces energy, trades it in wholesale markets, delivers retail energy plans, and is gradually reshaping its portfolio toward cleaner generation, flexible capacity, batteries, and customer energy services.
Its business is usually described through two main operating areas: customer-facing energy retail and energy supply. The retail side includes electricity, natural gas, telecom-related services in some offerings, and distributed energy products for homes and businesses. The supply side includes power generation, wholesale market operations, storage, and risk management. Recent annual reporting also reflects the company’s transition strategy, with legacy coal generation still important today while renewables, firming assets, and grid-scale batteries are becoming a bigger strategic priority.
Revenue is still dominated by the sale of electricity and gas to customers, with wholesale and generation activities also contributing materially. Exact product-level percentages are not always disclosed in a way that cleanly maps to total revenue, but the broad picture is clear:
- Retail electricity sales: the largest source of revenue, supported by AGL’s large customer base across Australia.
- Retail gas sales: a meaningful but smaller contributor than electricity.
- Wholesale electricity and generation-related income: includes output from AGL’s generation fleet, hedging, trading, and market optimization.
- Energy services and other customer products: a smaller contribution, including distributed energy solutions and related services.
AGL’s recent financial profile shows how exposed it remains to energy market swings. Total revenue has stayed around the low-to-mid A$13 billion range in recent years, but profitability has moved sharply depending on wholesale prices, hedging outcomes, plant performance, impairment charges, and transition spending. That makes AGL easier to understand as a major utility franchise than as a smooth earnings compounder.
The operating picture has been volatile rather than steadily improving. Revenue has remained fairly stable over several years, but the share of revenue left after fuel and purchased energy costs has moved around substantially. Profitability recovered strongly after a difficult period, which highlights both the resilience of the customer franchise and the sensitivity of results to market conditions and asset performance.
Key Figures
| Metric | Value | Sector ⓘ |
|---|---|---|
| Date | Oct 17, 2026 | |
| Context | ||
| Sector | Utilities | |
| Industry | Utilities - Independent Power Producers | |
| Market Cap ⓘ | $3.98B | |
| Beta ⓘ | 0.22 | |
Value (Cheapness) | ||
| P/E Ratio ⓘ | 7.78 | 17.28 |
| P/B Ratio ⓘ | 0.77 | 1.51 |
| FCF Yield ⓘ | -14.71% | 0.65% |
| Dividend Yield ⓘ | 5.90% | 3.77% |
| EBIT / EV ⓘ | N/A | 5.01% |
| PEG ⓘ | N/A | |
Growth (Business expansion) | ||
| Revenue Growth ⓘ | -4.70% | 6.10% |
| RPS Growth (5Y CAGR) ⓘ | -0.57% | 3.87% |
| EPS Growth (5Y CAGR) ⓘ | N/A | -11.30% |
| BVPS Growth (5Y CAGR) ⓘ | -5.81% | 4.23% |
| Margin Growth (5Y Trend) ⓘ | 0.28% | 3.57% |
| FCF Growth (5Y CAGR) ⓘ | N/A | -8.84% |
| DPS Growth (5Y CAGR) ⓘ | -0.33% | 4.84% |
Quality (Business durability) | ||
| ROIC (Latest) ⓘ | N/A | 6.53% |
| ROA (Latest) ⓘ | 4.27% | 3.20% |
| ROIC (5Y Median) ⓘ | 9.54% | 5.95% |
| ROA (5Y Median) ⓘ | 4.59% | 2.75% |
| Net Debt / EBIT (Latest) ⓘ | 2.11 | 7.13 |
| Net Debt / EBIT (5Y Median) ⓘ | 3.30 | 7.23 |
| Net Debt / EBITDA (Latest) ⓘ | 1.03 | 4.31 |
| Net Debt / Assets ⓘ | 23.21% | 38.42% |
| EBITDA / Interest ⓘ | 6.45 | 4.58 |
| Operating Margin (Latest) ⓘ | 6.30% | 20.83% |
| Operating Margin (5Y Median) ⓘ | 9.98% | 20.08% |
| Debt to Equity (Latest) ⓘ | 76.46% | 137.69% |
| Profit Margin (Latest) ⓘ | 5.43% | 11.37% |
| Free Cash Flow (Latest) ⓘ | -$585.00M | |
Momentum (Price trend) | ||
| 3Y Return ⓘ | +4.23% | +52.37% |
| 12M Return (excl. last month) ⓘ | +13.26% | +8.84% |
| 6M Return ⓘ | -10.25% | -3.95% |
| Price vs. 200-Day MA ⓘ | +2.19% | -0.79% |
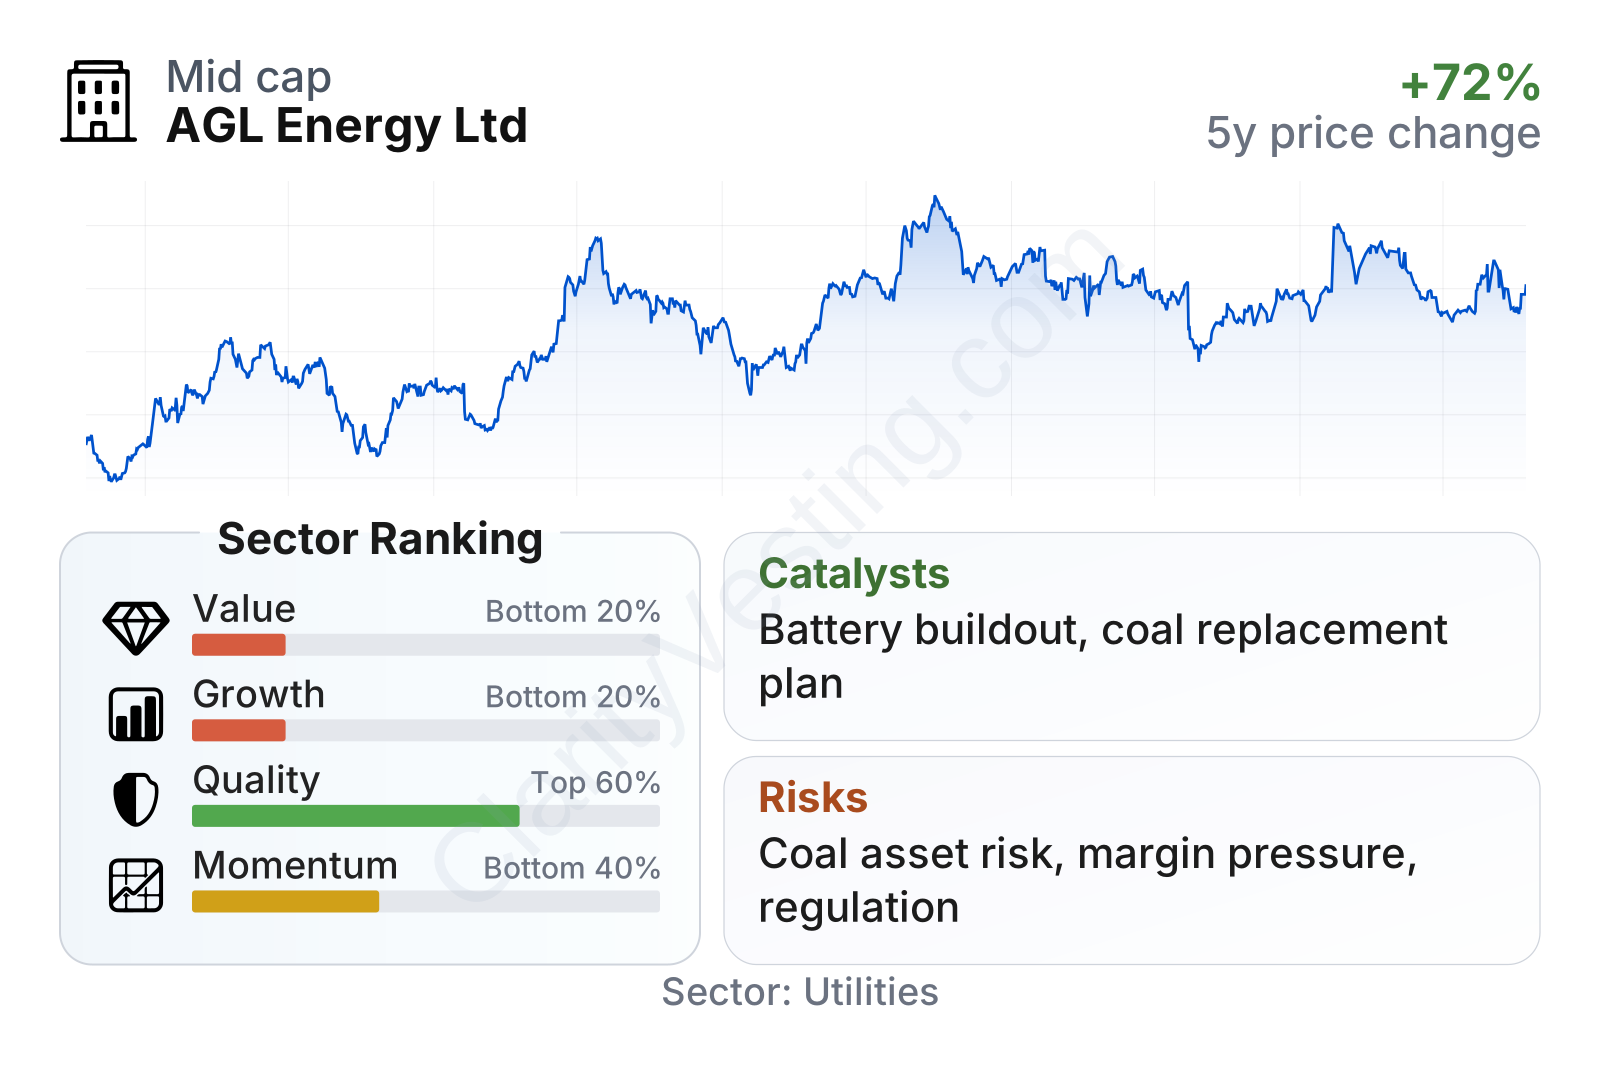
AGL stands out as a medium-sized utility with unusually low share-price volatility for a listed power company, reflected in a beta well below 1. On valuation measures, the shares screen cheaper than much of the sector, with a low earnings multiple and price-to-book ratio. However, that discount comes with weaker growth indicators and currently negative trailing free cash flow, so the low multiples should be read as a reflection of mixed fundamentals rather than a simple sign of strength.
The table also points to an important split in AGL’s profile. Balance-sheet and debt-servicing measures look healthier than many sector peers, but margins are thinner than the industry median. In other words, leverage does not appear extreme for the business, yet the company has less room for operational mistakes than stronger-margin utilities.
The stock’s medium-term trading record supports that mixed view. Over three years the return has lagged the broader utility peer group, although shorter-term performance has shown periods of recovery. This is the kind of profile often seen when a company is moving through a major transition and the market is still debating how durable the turnaround will be.
Growth
AGL operates in a sector that is structurally changing rather than simply growing in a straight line. Electricity demand in Australia is being reshaped by coal retirements, renewable generation buildout, battery storage, electrification, and the need for more flexible capacity to support grid reliability. That backdrop creates opportunity for companies that can replace aging assets with newer, lower-emission generation and storage while keeping strong customer relationships.
AGL’s strategy broadly fits that industry direction. The company has been repositioning itself around three themes: maintaining a large retail customer base, investing in grid-scale batteries and flexible assets, and managing the staged closure of coal-fired generation over time. This approach makes strategic sense because the company already has scale, market access, customer data, trading capabilities, and a large installed position in the Australian power system. If execution is solid, those pieces can help AGL remain relevant even as the generation mix changes.
One caution is that top-line growth has not been consistent. Revenue per share has stayed in a relatively narrow range over the last several years instead of showing a clear upward slope. That suggests the growth case is less about rapid expansion in sales and more about improving asset mix, better margins, and extracting value from the transition of the power system.
Cash generation is another area to watch closely. AGL has shown the ability to produce meaningful cash in stronger periods, but current trailing free cash flow is negative, which likely reflects a mix of investment needs, working-capital movements, and the uneven economics of the transition. For a utility in portfolio renewal mode, that is not automatically alarming, but long-term progress depends on new projects eventually converting into steadier cash returns.
Recent company updates have highlighted battery development, customer platform initiatives, and continued work on replacing legacy coal capacity with firming and cleaner sources. Those are credible catalysts because they match broader market needs in Australia: more dispatchable support for renewables, better energy management, and a reliable pathway through the retirement of older thermal assets. If regulatory settings remain supportive and projects are delivered on time, AGL has a visible opportunity to reshape earnings quality over the next several years.
Risks
This article is for informational purposes only and does not constitute financial advice. Some content is AI-generated. See Disclaimer


