Stock Analysis · AmTrust Financial Services Inc (AFSIM)
Overview
AmTrust Financial Services is a property and casualty insurer focused mainly on small and midsize businesses. The company underwrites workers’ compensation, business owner policies, extended service and warranty coverage, and other specialty commercial insurance products. It also earns investment income by managing the large pool of assets that insurers hold to pay future claims.
Based on the company’s recent public filings, revenue is primarily generated from insurance-related premiums, with a smaller but still meaningful contribution from investment income and other fee-based activities tied to service and warranty operations. The business mix is centered on specialty commercial lines rather than broad personal insurance.
- Net earned premiums: approximately 70% to 80% of total revenue. This is the core insurance business and includes workers’ compensation, commercial package products, and other specialty property and casualty coverage.
- Net investment income: approximately 10% to 20% of total revenue. This comes from bonds, cash investments, and other portfolio assets backing insurance liabilities.
- Fee and other insurance-related income: approximately 5% to 15% of total revenue. This includes service and warranty-related business, commissions, and other operating income connected to specialty insurance programs.
That mix matters for long-term analysis because AmTrust is not just exposed to underwriting results; it also depends on investment returns and claims discipline. In insurance, stable growth is valuable, but the quality of that growth depends heavily on pricing, reserve accuracy, and the ability to earn adequate returns on invested assets.
Key Figures
| Metric | Value | Sector ⓘ |
|---|---|---|
| Date | Oct 24, 2026 | |
| Context | ||
| Sector | Financial Services | |
| Industry | Insurance - Property & Casualty | |
| Market Cap ⓘ | $3.03B | |
| Beta ⓘ | 0.36 | |
Value (Cheapness) | ||
| P/E Ratio ⓘ | 15.71 | 12.46 |
| P/B Ratio ⓘ | 0.86 | 1.25 |
| FCF Yield ⓘ | 1.66% | 9.82% |
| Dividend Yield ⓘ | 2.27% | 2.94% |
| EBIT / EV ⓘ | 0.05% | 8.11% |
| PEG ⓘ | N/A | |
Growth (Business expansion) | ||
| Revenue Growth ⓘ | 7.10% | 9.10% |
| RPS Growth (5Y CAGR) ⓘ | 546.87% | 12.31% |
| EPS Growth (5Y CAGR) ⓘ | N/A | -6.97% |
| BVPS Growth (5Y CAGR) ⓘ | 547.29% | 5.02% |
| Margin Growth (5Y Trend) ⓘ | N/A | -4.00% |
| FCF Growth (5Y CAGR) ⓘ | N/A | 4.71% |
| DPS Growth (5Y CAGR) ⓘ | 721.69% | 8.92% |
Quality (Business durability) | ||
| ROIC (Latest) ⓘ | N/A | 9.18% |
| ROE (Latest) ⓘ | N/A | 13.93% |
| ROA (Latest) ⓘ | 0.75% | 1.57% |
| ROIC (5Y Median) ⓘ | N/A | 7.80% |
| ROE (5Y Median) ⓘ | N/A | 12.15% |
| ROA (5Y Median) ⓘ | N/A | 1.28% |
| Net Debt / EBIT (Latest) ⓘ | 0.43 | 1.02 |
| Net Debt / EBIT (5Y Median) ⓘ | N/A | 0.72 |
| Net Debt / EBITDA (Latest) ⓘ | 0.02 | 0.88 |
| Operating Margin (Latest) ⓘ | 36.40% | 22.30% |
| Operating Margin (5Y Median) ⓘ | N/A | 24.50% |
| Debt to Equity (Latest) ⓘ | 43.85% | 59.34% |
| Profit Margin (Latest) ⓘ | 4.33% | 26.42% |
| Free Cash Flow (Latest) ⓘ | $50.48M | |
Momentum (Price trend) | ||
| 3Y Return ⓘ | +67.99% | +95.73% |
| 12M Return (excl. last month) ⓘ | -1.44% | +17.30% |
| 6M Return ⓘ | +1.79% | +6.07% |
| Price vs. 200-Day MA ⓘ | +2.22% | +5.36% |
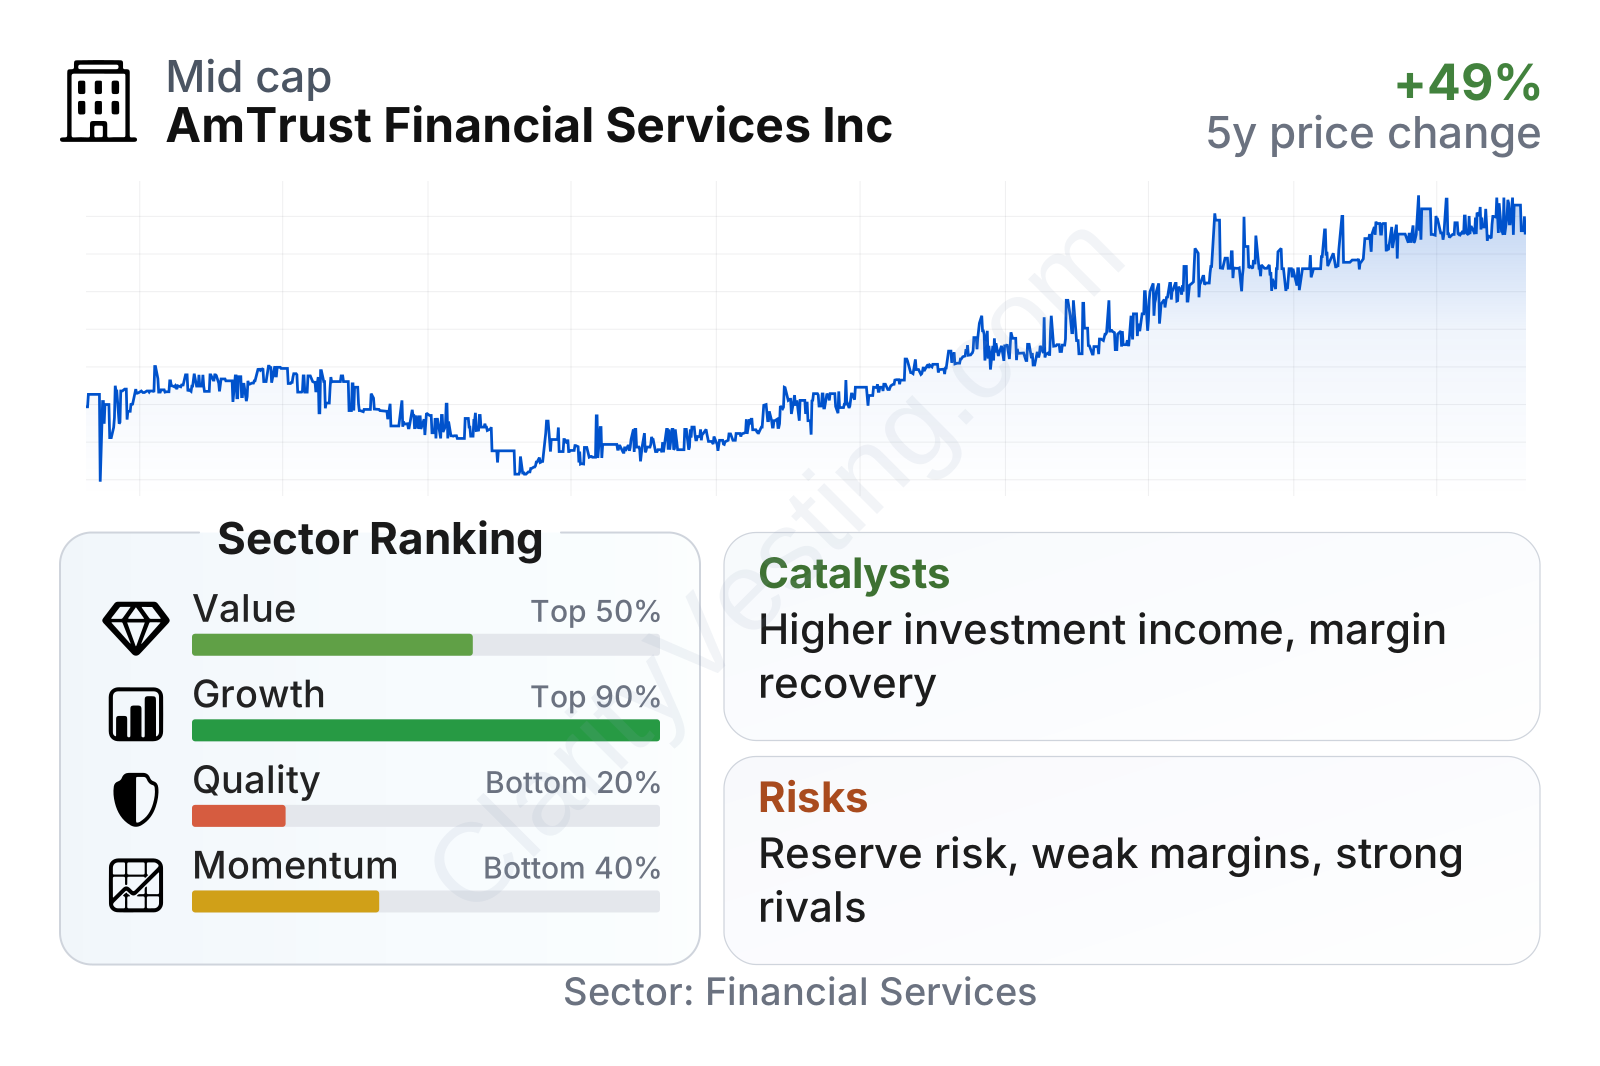
AmTrust sits in the smaller end of the listed financial sector by market value, and its share price has trended upward over the last several years with some periods of volatility along the way. The stock’s beta is low, which suggests it has historically moved less than the broader market. That can be typical for insurers, where earnings are driven more by underwriting cycles and investment income than by fast-changing consumer demand.
The most notable point in the current metrics is the contrast between growth and quality. Growth measures rank strongly versus the broader sector, helped by unusually strong long-term expansion in revenue per share, book value per share, and dividends per share. However, profitability and capital-efficiency measures rank much weaker. Returns on assets and margins are below sector medians, while leverage compared with EBIT is elevated. In simple terms, the company has been growing, but that growth has not translated into the same level of operating efficiency seen at stronger peers.
Growth
The property and casualty insurance sector is not a high-growth industry in the way software or biotech can be, but it is a large and resilient one. Demand is supported by regulation, business formation, payroll growth, vehicle ownership, and the need to manage risk in an increasingly complex economy. Within that landscape, AmTrust’s focus on small commercial accounts and specialty lines gives it access to niches where pricing and underwriting expertise can matter more than sheer scale.
The company’s strategy is broadly sensible for future expansion. Small business insurance and specialty commercial products can offer recurring demand and room for tailored pricing. Extended warranty and service contract operations can also add diversification beyond traditional commercial insurance. For insurers, another important growth lever is investment income, and the higher-rate environment has generally improved reinvestment opportunities across fixed-income portfolios.
One encouraging element is that recent multi-year growth indicators remain strong. Revenue per share and book value per share have risen at rates far above the sector median, which suggests the company has been able to compound its business base over time. Dividend growth has also been materially stronger than the industry median, which can indicate confidence in ongoing cash generation, even if free cash flow yield currently appears modest.
A practical catalyst for AmTrust is continued firm pricing in commercial insurance lines, particularly if loss trends remain manageable. Another potential support is stronger income from invested assets as maturing bonds are replaced at higher yields. If underwriting margins improve from current subdued levels, even modest progress could have an outsized effect on reported profitability because the market already values the company below book value.
Risks
This article is for informational purposes only and does not constitute financial advice. Some content is AI-generated. See Disclaimer


