Stock Analysis · American Financial Group Inc (AFG)
Overview
American Financial Group is a specialized property and casualty insurer. In simple terms, it sells insurance policies that help businesses and organizations cover losses from events such as accidents, liability claims, property damage, transportation losses, and other commercial risks. The group also invests the premiums it collects before claims are paid, which creates an additional source of income. AFG has historically focused on niche commercial insurance lines rather than broad personal insurance categories such as mass-market auto or home coverage.
The company’s business is centered on its property and casualty operations, especially specialty insurance. In recent years, AFG has become more focused after exiting businesses outside that core area. Based on recent company reporting, the main economic sources behind revenue and earnings can be described as follows:
- Specialty Property & Casualty insurance premiums and related underwriting revenue: approximately 80% to 90% of total revenue. This includes businesses such as property and transportation, specialty casualty, and specialty financial lines. These policies are written for commercial customers and often target narrower markets where pricing discipline and underwriting expertise matter.
- Net investment income: approximately 10% to 20% of total revenue, depending on market conditions and portfolio yields. Insurers invest policyholder funds, mainly in fixed-income securities and other investments, and this can materially support profitability.
- Other non-core items: a small share of revenue, typically including realized gains or losses and miscellaneous items that can move results from year to year but are not the main driver of the business.
AFG’s profile is therefore less about rapid expansion and more about careful risk selection, pricing discipline, and steady returns from underwriting plus investment income. That makes it different from many financial companies: results are driven not only by sales growth, but also by whether the company prices risk correctly and manages claims well.
The long-term revenue picture shows a business that expanded from a little above $6 billion in 2021 to slightly above $8 billion in 2025, while operating income and net income stayed positive throughout the period. That pattern suggests a company with durable earning power, even if profits can fluctuate with insurance cycles and catastrophe activity.
Over the last several years, revenue has trended upward overall, while profitability has remained solid rather than consistently rising. That is typical for a commercial insurer: growth can be visible in premiums, but earnings still move with claims costs, reserve development, catastrophe exposure, and investment markets.
Key Figures
| Metric | Value | Sector ⓘ |
|---|---|---|
| Date | Oct 03, 2026 | |
| Context | ||
| Sector | Financial Services | |
| Industry | Insurance - Property & Casualty | |
| Market Cap ⓘ | $11.34B | |
| Beta ⓘ | 0.60 | |
Value (Cheapness) | ||
| P/E Ratio ⓘ | 12.10 | 12.60 |
| P/B Ratio ⓘ | 2.38 | 1.23 |
| FCF Yield ⓘ | 12.62% | 10.16% |
| Dividend Yield ⓘ | 2.54% | 2.96% |
| EBIT / EV ⓘ | 10.79% | 7.77% |
| PEG ⓘ | 2.30 | |
Growth (Business expansion) | ||
| Revenue Growth ⓘ | 5.80% | 9.50% |
| RPS Growth (5Y CAGR) ⓘ | 7.50% | 12.10% |
| EPS Growth (5Y CAGR) ⓘ | -18.97% | -9.45% |
| BVPS Growth (5Y CAGR) ⓘ | -0.35% | 5.01% |
| Margin Growth (5Y Trend) ⓘ | -8.73% | -4.07% |
| FCF Growth (5Y CAGR) ⓘ | -2.77% | 4.96% |
| DPS Growth (5Y CAGR) ⓘ | -28.48% | 8.79% |
Quality (Business durability) | ||
| ROIC (Latest) ⓘ | 15.55% | 9.60% |
| ROE (Latest) ⓘ | 19.96% | 13.84% |
| ROA (Latest) ⓘ | 3.18% | 1.53% |
| ROIC (5Y Median) ⓘ | 15.43% | 7.86% |
| ROE (5Y Median) ⓘ | 20.33% | 12.20% |
| ROA (5Y Median) ⓘ | 3.50% | 1.29% |
| Net Debt / EBIT (Latest) ⓘ | 0.30 | 0.91 |
| Net Debt / EBIT (5Y Median) ⓘ | 0.41 | 0.74 |
| Net Debt / EBITDA (Latest) ⓘ | 0.28 | 0.97 |
| Operating Margin (Latest) ⓘ | 15.80% | 22.12% |
| Operating Margin (5Y Median) ⓘ | 14.87% | 24.39% |
| Debt to Equity (Latest) ⓘ | 37.77% | 60.37% |
| Profit Margin (Latest) ⓘ | 11.83% | 26.62% |
| Free Cash Flow (Latest) ⓘ | $1.43B | |
Momentum (Price trend) | ||
| 3Y Return ⓘ | +50.14% | +89.23% |
| 12M Return (excl. last month) ⓘ | +10.40% | +17.35% |
| 6M Return ⓘ | +9.48% | +10.00% |
| Price vs. 200-Day MA ⓘ | +3.12% | +3.73% |
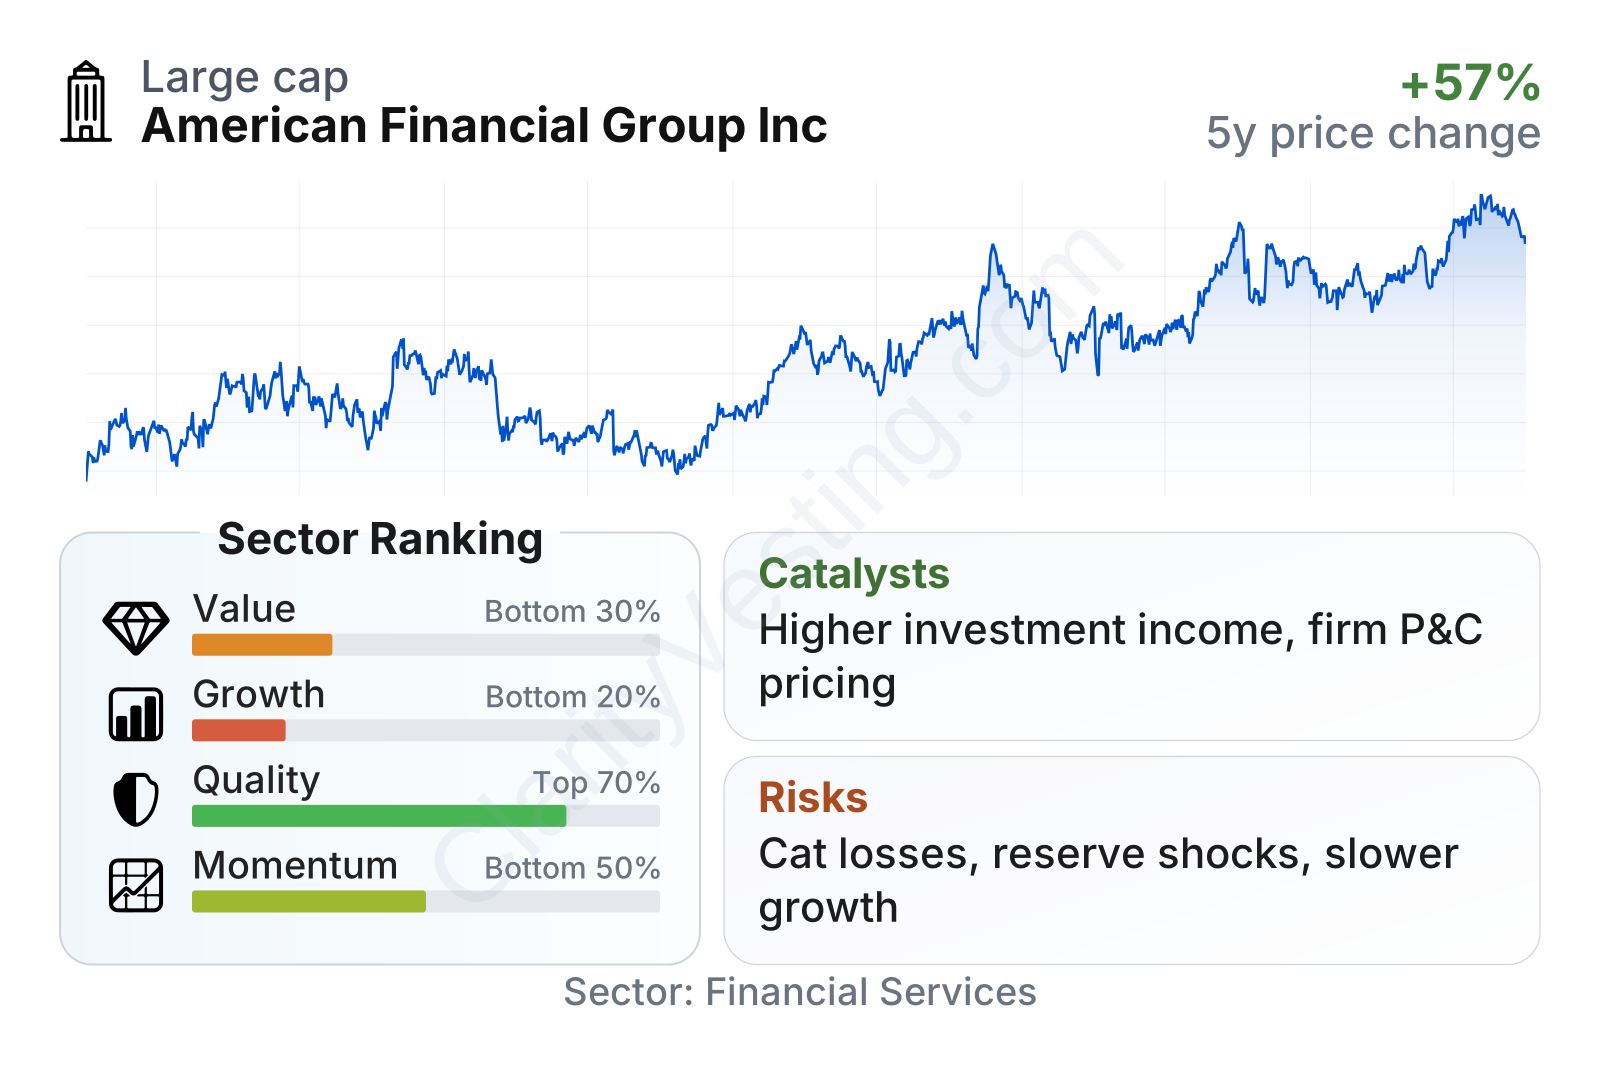
AFG is a mid-sized insurer with a relatively low beta of about 0.6, which points to lower share-price volatility than the broader market. Profitability quality stands out more than growth: returns on equity and assets are well above sector medians, leverage is moderate, and free cash flow generation is solid. By contrast, growth metrics are weaker, with slower revenue expansion than the sector median and pressure on five-year earnings and book value trends. The market appears to recognize AFG’s quality, as shown by a price-to-book multiple clearly above the sector norm, while the earnings multiple sits closer to the industry range.
Growth
AFG operates in a sector that has favorable long-term demand. Businesses continue to need specialized commercial insurance, and that need tends to persist regardless of the economic cycle. Over time, rising asset values, more complex liability environments, supply-chain risks, transportation exposure, and weather-related losses all support demand for specialty coverage. In that sense, the company is in a structurally relevant market, even if it is not a high-growth industry in the way software or semiconductors might be.
The company’s strategy also makes sense for its niche. AFG emphasizes specialized underwriting where deep expertise can matter more than raw size. That approach can support better pricing and better risk selection than in more commoditized insurance lines. It also helps the company avoid competing head-on with the largest insurers in every category. In specialty insurance, disciplined underwriting often creates stronger long-term results than simply chasing premium growth.
Earnings per share have been positive and fairly resilient, though not clearly on a strong upward slope over the last several years. That matters because it shows the company has kept generating profit through different insurance conditions, but it also shows why the stock is not typically valued as a fast-growing compounder. The growth case depends more on steady underwriting returns, higher investment income, and selective premium expansion than on explosive earnings acceleration.
Book value per share, an important measure for insurers because it reflects the capital base supporting the business, has recovered from its 2022 decline and moved back upward through 2025. That recovery is a constructive sign. It suggests the company rebuilt capital after a more difficult period, although the five-year trend is still much softer than many investors prefer. For a long-term case, sustained growth in book value would be one of the clearest indicators to watch.
A practical catalyst for AFG is the interest-rate environment. Insurers invest heavily in bonds, and higher portfolio yields can lift investment income as older securities mature and are replaced with higher-yielding assets. Another catalyst is continued firmness in commercial insurance pricing, especially in specialty lines where underwriting conditions remain disciplined. If pricing stays rational and claims trends remain manageable, AFG can improve profitability even without very rapid top-line growth.
Recent company updates have also continued to reflect active portfolio management, including regular capital actions and ongoing attention to underwriting margins by business line. For AFG, the most meaningful opportunities usually come not from a single headline event, but from a combination of stable premium growth, better reinvestment yields, and disciplined underwriting execution.
Risks
This article is for informational purposes only and does not constitute financial advice. Some content is AI-generated. See Disclaimer


