Stock Analysis · Atlas Energy Solutions Inc (AESI)
Overview
Atlas Energy Solutions Inc is an oilfield services company focused on the U.S. onshore drilling and completion market, especially the Permian Basin. In simple terms, it helps oil and gas producers complete wells by supplying and moving the large volumes of sand used in hydraulic fracturing, while also providing related logistics and handling services. The business has expanded beyond being only a sand seller and is building a broader completion-services platform around last-mile delivery, storage, handling, and newer technologies tied to well-site operations.
The company’s revenue mix is still heavily centered on proppant, the specialized sand pumped into wells during fracking. Based on recent annual disclosures, the largest source of revenue remains product sales, with service and freight-related activity making up the rest. A practical way to think about the business is the following:
- Sand and proppant product sales: approximately 70% to 80% of revenue. This includes the sale of frac sand mined and processed by Atlas, mainly to exploration and production companies and pressure-pumping customers.
- Logistics, trucking, and well-site delivery services: approximately 15% to 25% of revenue. This covers moving sand from mines to the basin and then to the well site, including last-mile solutions and related handling infrastructure.
- Other completion-related services and equipment activity: a smaller share of revenue. This includes newer offerings added through expansion efforts and acquisitions, which are meant to deepen Atlas’s role in the completion chain rather than rely only on commodity sand pricing.
That structure matters because it shows both the opportunity and the challenge. Atlas benefits from high activity in U.S. shale completions, but it also remains exposed to a market where volumes, pricing, and customer spending can change quickly. Over the last few years, revenue rose sharply as the company scaled, yet the earnings profile became more pressured as costs increased and margins narrowed.
The long-term picture behind the operating flow is clear: revenue expanded dramatically from 2021 through 2025, but profitability did not keep pace. Gross profit and operating income strengthened early in the cycle, then came under pressure as cost of revenue, selling expenses, and interest expense rose faster than the benefits of higher sales.
Key Figures
| Metric | Value | Sector ⓘ |
|---|---|---|
| Date | Oct 17, 2026 | |
| Context | ||
| Sector | Energy | |
| Industry | Oil & Gas Equipment & Services | |
| Market Cap ⓘ | $1.48B | |
| Beta ⓘ | 1.16 | |
Value (Cheapness) | ||
| P/E Ratio ⓘ | N/A | 15.44 |
| P/B Ratio ⓘ | 1.24 | 1.73 |
| FCF Yield ⓘ | -12.44% | 8.20% |
| Dividend Yield ⓘ | N/A | 3.59% |
| EBIT / EV ⓘ | -4.08% | 7.46% |
| PEG ⓘ | N/A | |
Growth (Business expansion) | ||
| Revenue Growth ⓘ | 1.60% | 26.90% |
| RPS Growth (5Y CAGR) ⓘ | 50.93% | 6.90% |
| EPS Growth (5Y CAGR) ⓘ | N/A | -15.73% |
| BVPS Growth (5Y CAGR) ⓘ | 30.67% | 6.07% |
| Margin Growth (5Y Trend) ⓘ | -28.36% | 0.58% |
| FCF Growth (5Y CAGR) ⓘ | N/A | 1.86% |
| DPS Growth (5Y CAGR) ⓘ | 65.69% | 16.79% |
Quality (Business durability) | ||
| ROIC (Latest) ⓘ | -3.97% | 11.40% |
| ROA (Latest) ⓘ | -4.94% | 6.06% |
| ROIC (5Y Median) ⓘ | 17.22% | 10.30% |
| ROA (5Y Median) ⓘ | 3.71% | 5.42% |
| Net Debt / EBIT (Latest) ⓘ | N/A | 1.64 |
| Net Debt / EBIT (5Y Median) ⓘ | 1.57 | 1.83 |
| Net Debt / EBITDA (Latest) ⓘ | 7.20 | 1.08 |
| Net Debt / Assets ⓘ | 31.25% | 17.29% |
| EBITDA / Interest ⓘ | 1.76 | 9.64 |
| Operating Margin (Latest) ⓘ | -8.86% | 16.27% |
| Operating Margin (5Y Median) ⓘ | 27.43% | 20.39% |
| Debt to Equity (Latest) ⓘ | 86.86% | 54.76% |
| Profit Margin (Latest) ⓘ | -11.08% | 8.82% |
| Free Cash Flow (Latest) ⓘ | -$184.12M | |
Momentum (Price trend) | ||
| 3Y Return ⓘ | -39.67% | +67.38% |
| 12M Return (excl. last month) ⓘ | +21.67% | +49.19% |
| 6M Return ⓘ | -7.67% | +7.07% |
| Price vs. 200-Day MA ⓘ | -17.87% | +9.56% |
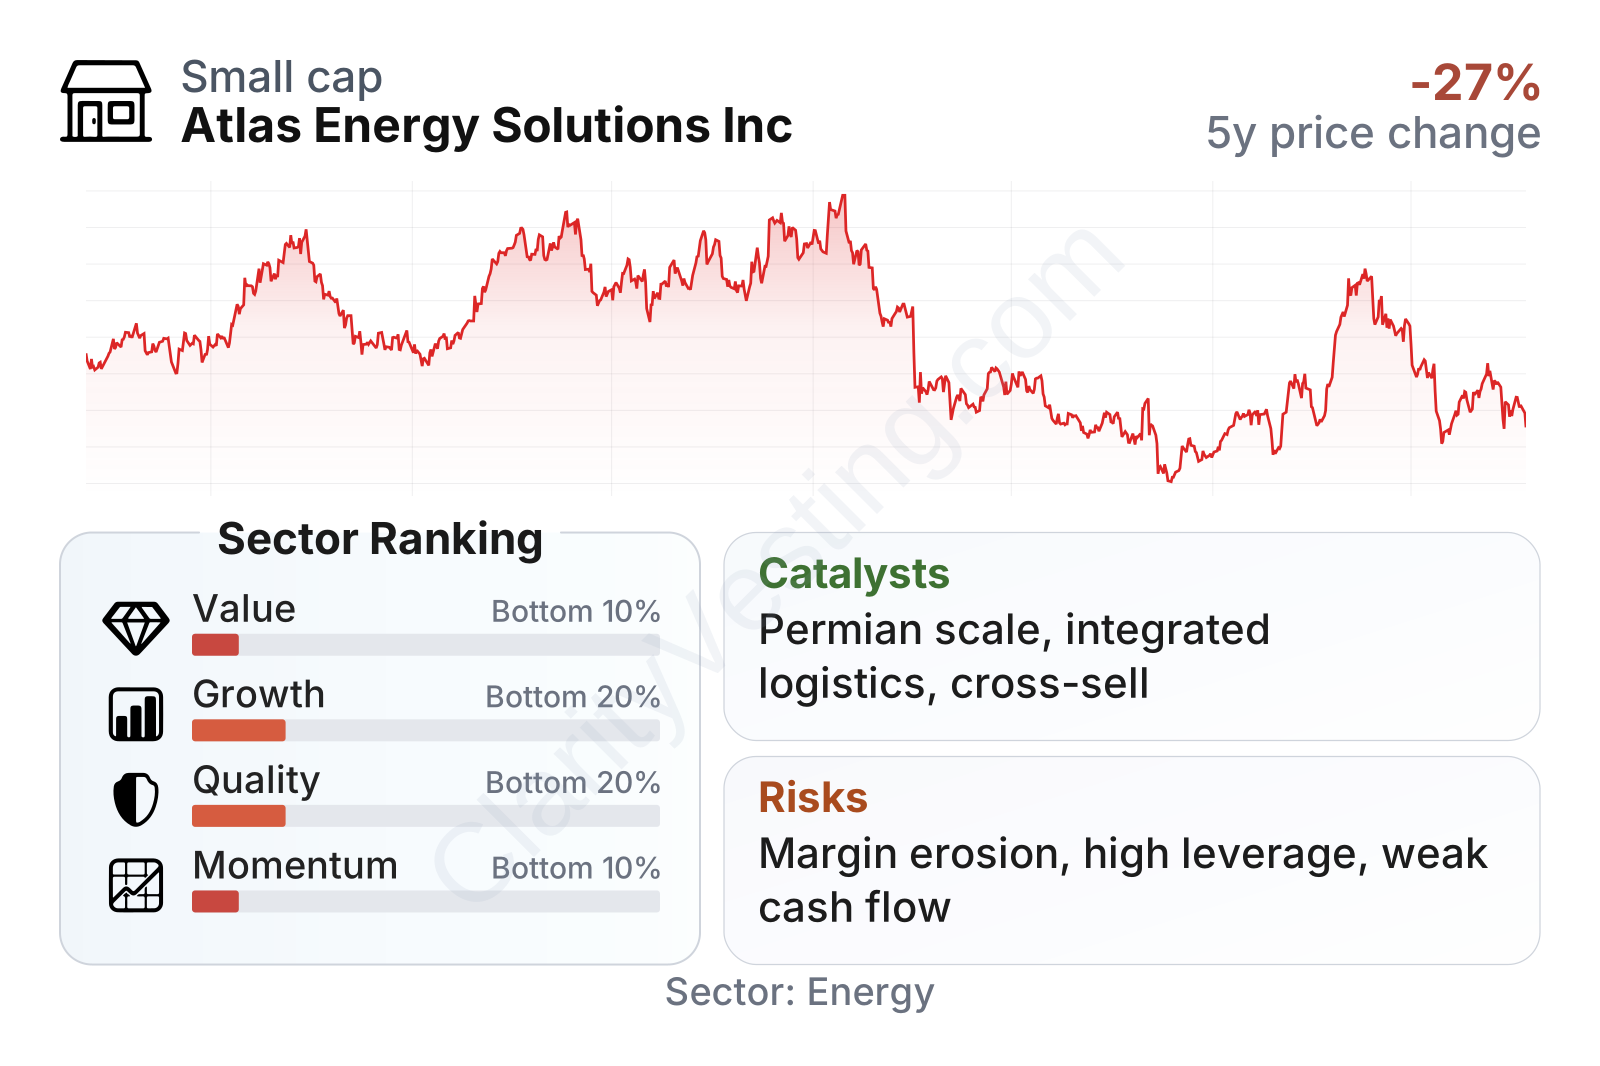
Atlas sits in the smaller public-company range within the energy services space, with a stock that has been noticeably more volatile than the broader market. The factor snapshot is weak overall: value ranks in the bottom 10% of the sector, while growth and quality are both in the bottom 20%, and momentum is also in the bottom 10%. That combination usually signals a company whose market valuation looks low for a reason rather than one that is simply overlooked. The pressure is especially visible in negative free cash flow, negative trailing operating returns, and a recent profitability profile that trails the typical energy peer.
Growth
Atlas operates in a sector that still has long-term relevance, even if it is not a classic secular growth industry. U.S. shale production requires large, ongoing completion activity, and sand remains an essential consumable in that process. As long as the Permian Basin stays one of the most active and economic oil regions in North America, demand for efficient sourcing and delivery of proppant should remain meaningful. That gives Atlas a durable market, although not a smooth one.
The company’s strategy makes sense on paper. Instead of depending only on selling sand, Atlas has been trying to control more of the value chain: mining, processing, transportation, storage, and on-site delivery. That can create a more integrated offering for customers and may improve stickiness if operators prefer a provider that can reduce delays, trucking complexity, and operational inefficiency. Atlas has also highlighted newer technologies and adjacent service lines as ways to widen its role on location.
The revenue pattern shows why the market has become more cautious. Growth was very strong through much of 2024, with year-over-year increases that at times approached or exceeded 75% and even 90%. But that pace faded sharply in 2025 and turned negative in several periods before stabilizing around flat to slightly positive by mid-2026. In other words, Atlas has already captured a big growth burst, and the current issue is whether it can convert scale into steadier, more profitable expansion.
Cash generation has also been uneven. Free cash flow moved from positive territory in 2023 to substantially negative levels during the expansion phase, then showed some improvement in 2026. That pattern often appears when a company is investing heavily in capacity, acquisitions, or equipment, but it also raises a practical question for long-term shareholders: whether those investments will eventually produce higher returns rather than simply bigger revenue.
A notable catalyst is Atlas’s push to broaden its completion-services platform in the Permian. If management can improve utilization across its logistics network and newer assets, the company may benefit from cross-selling and more recurring service relationships. Another important opportunity is industry preference for efficiency: operators increasingly want fewer vendors, lower delivered cost per ton, and better reliability at the well site. Atlas is positioned around those needs, which gives its strategy an industrial logic even in a cyclical market.
Risks
This article is for informational purposes only and does not constitute financial advice. Some content is AI-generated. See Disclaimer


