Stock Analysis · The AES Corporation (AES)
Overview
The AES Corporation is a global power company that owns and operates electricity generation assets, sells power under long-term contracts, manages utilities in selected markets, and is increasingly focused on renewable energy, energy storage, and digital infrastructure-related power demand. In simple terms, AES makes money by producing electricity, delivering it to customers in some regulated service areas, and building new power projects for corporate and utility buyers. Its portfolio spans the United States, Latin America, and other international markets, with a strategy centered on replacing older fossil fuel assets with renewables, batteries, and contracted generation.
AES reports its business through Strategic Business Units rather than a simple product list, so an exact companywide revenue split by technology is not always presented in one clean table. Based on its recent annual reporting structure, revenue mainly comes from the following sources:
- Utilities and regulated power sales — the largest source of revenue, coming from electricity distribution and retail supply businesses where rates are generally set through regulatory frameworks.
- Energy infrastructure generation — power produced by plants selling electricity, capacity, and related services under contracts or into wholesale markets.
- Renewables and energy storage projects — solar, wind, battery storage, and hybrid projects, often supported by long-term power purchase agreements with utilities, corporations, and data-center-linked customers.
- Other energy-related services and development activity — including project development, construction-stage monetization, and smaller ancillary revenue streams.
Geographically, AES remains diversified, with meaningful exposure to the U.S. and international markets. That diversification helps reduce dependence on a single power market, although it also adds currency, political, and regulatory complexity. Recent financial flow trends suggest a business with fairly stable revenue around the low-$12 billion range in recent years, while profitability improved sharply from 2023 into 2024 before moderating again in 2025. Interest expense remains a major claim on earnings, which is important for understanding both the opportunity and the risk in the equity.
The financial flow over the last several years shows a useful pattern: revenue has been relatively steady, operating income improved significantly versus earlier loss-making periods, and net income turned positive, but financing costs still absorb a large portion of operating gains. That makes execution on new projects and balance-sheet discipline especially important.
Key Figures
| Metric | Value | Sector ⓘ |
|---|---|---|
| Date | Oct 17, 2026 | |
| Context | ||
| Sector | Utilities | |
| Industry | Utilities - Diversified | |
| Market Cap ⓘ | $10.69B | |
| Beta ⓘ | 0.95 | |
Value (Cheapness) | ||
| P/E Ratio ⓘ | 5.61 | 17.28 |
| P/B Ratio ⓘ | 95.50 | 1.51 |
| FCF Yield ⓘ | -16.08% | 0.65% |
| Dividend Yield ⓘ | 4.70% | 3.77% |
| EBIT / EV ⓘ | 5.70% | 5.01% |
| PEG ⓘ | 1.09 | |
Growth (Business expansion) | ||
| Revenue Growth ⓘ | 19.90% | 6.10% |
| RPS Growth (5Y CAGR) ⓘ | 0.67% | 3.87% |
| EPS Growth (5Y CAGR) ⓘ | -6.85% | -11.30% |
| BVPS Growth (5Y CAGR) ⓘ | 137.05% | 4.23% |
| Margin Growth (5Y Trend) ⓘ | 14.25% | 3.57% |
| FCF Growth (5Y CAGR) ⓘ | N/A | -8.84% |
| DPS Growth (5Y CAGR) ⓘ | 3.97% | 4.84% |
Quality (Business durability) | ||
| ROIC (Latest) ⓘ | 5.83% | 6.53% |
| ROA (Latest) ⓘ | 3.63% | 3.20% |
| ROIC (5Y Median) ⓘ | 3.03% | 5.95% |
| ROA (5Y Median) ⓘ | 0.58% | 2.75% |
| Net Debt / EBIT (Latest) ⓘ | 13.03 | 7.13 |
| Net Debt / EBIT (5Y Median) ⓘ | 18.58 | 7.23 |
| Net Debt / EBITDA (Latest) ⓘ | 7.66 | 4.31 |
| Net Debt / Assets ⓘ | 55.90% | 38.42% |
| EBITDA / Interest ⓘ | 2.75 | 4.58 |
| Operating Margin (Latest) ⓘ | 17.83% | 20.83% |
| Operating Margin (5Y Median) ⓘ | 11.09% | 20.08% |
| Debt to Equity (Latest) ⓘ | 649.88% | 137.69% |
| Profit Margin (Latest) ⓘ | 14.34% | 11.37% |
| Free Cash Flow (Latest) ⓘ | -$1.72B | |
Momentum (Price trend) | ||
| 3Y Return ⓘ | +31.68% | +52.37% |
| 12M Return (excl. last month) ⓘ | +20.63% | +8.84% |
| 6M Return ⓘ | +6.43% | -3.95% |
| Price vs. 200-Day MA ⓘ | +3.09% | -0.79% |
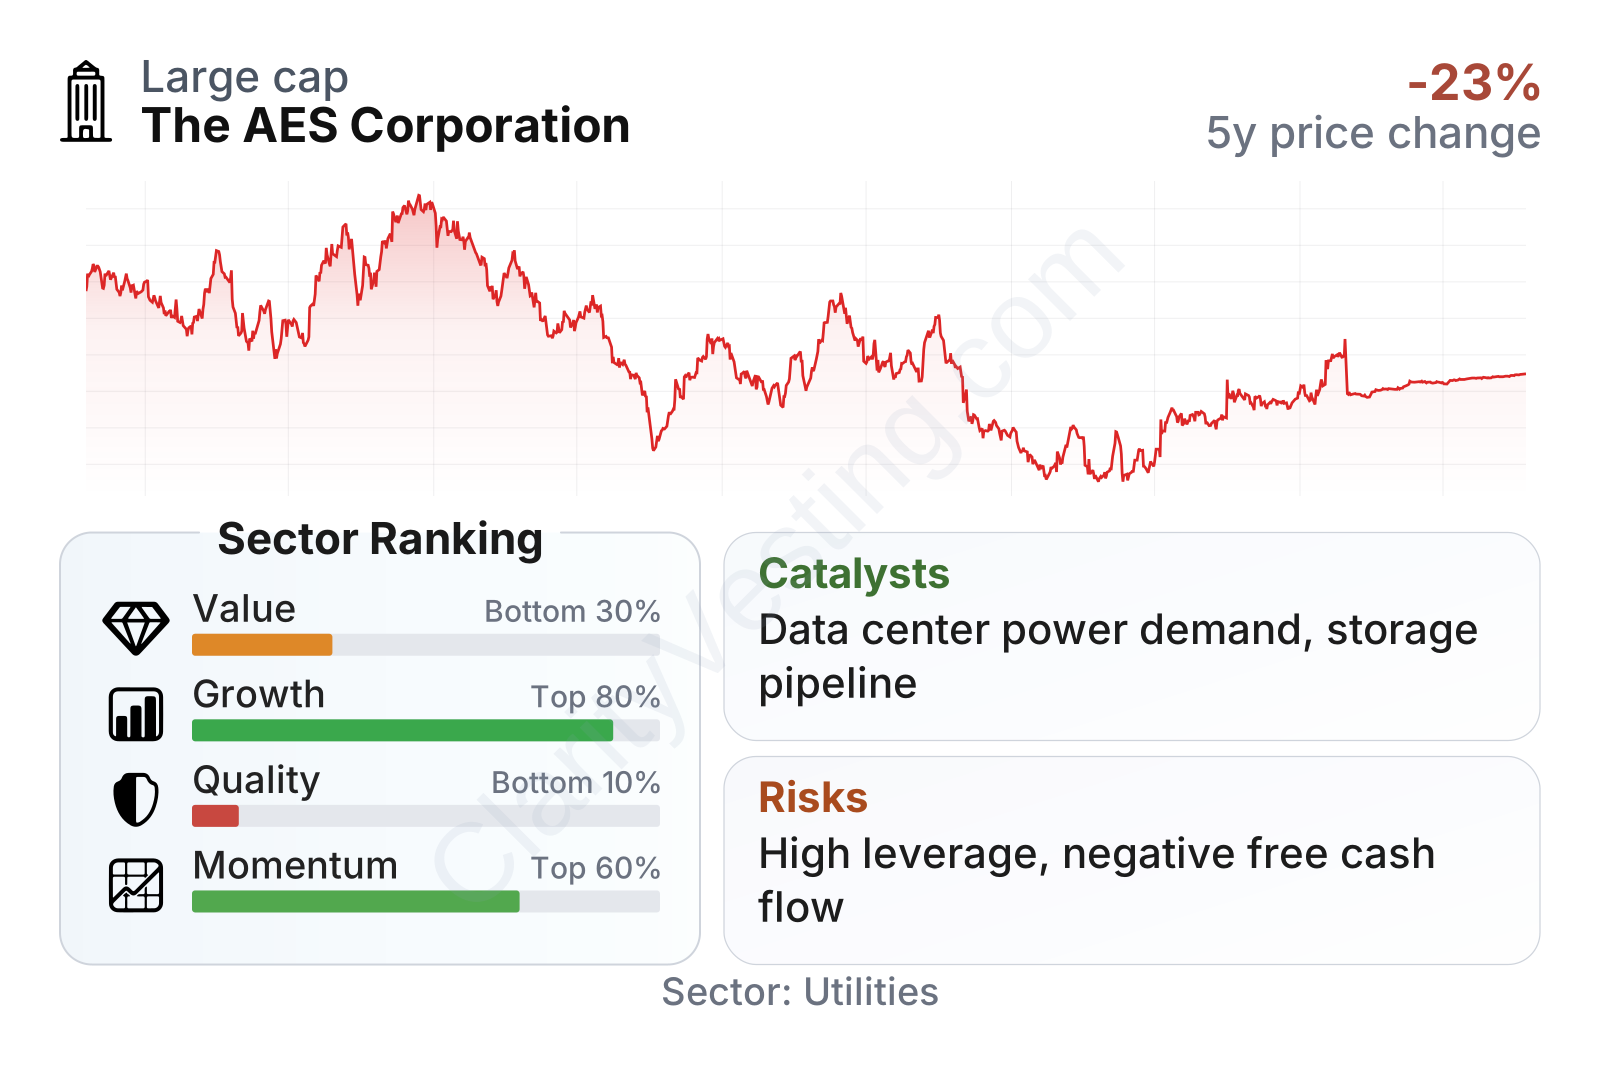
AES looks mixed on core metrics. Growth indicators are relatively strong compared with much of the utility sector, but quality measures remain weak because leverage is high and free cash flow is still negative. The share price has recovered from prior lows and recent momentum has been better than the sector median over shorter periods, yet the business still carries a balance-sheet profile that limits flexibility. On valuation screens, the earnings multiple appears very low versus the sector, but that low multiple needs to be read alongside debt, capital intensity, and inconsistent cash generation.
Growth
AES operates in a sector with a strong long-term demand backdrop. Electricity demand is being supported by grid modernization, electrification, industrial reshoring, and especially the rapid growth of data centers. At the same time, utilities and large corporate buyers are still signing long-term contracts for cleaner power sources. This environment is favorable for companies that can develop, finance, and operate renewable generation and battery storage at scale.
AES’s strategy fits that trend reasonably well. The company has spent the last several years pushing deeper into renewables, storage, and long-duration contracted assets, while also working with corporate customers that need large volumes of reliable clean power. That matters because contract-backed projects can create multi-year visibility on revenue, which is especially valuable in an industry where upfront capital spending is heavy.
Revenue per share has been broadly stable rather than explosive. That may seem underwhelming at first glance, but in utilities, growth is often driven less by rapid sales expansion and more by adding long-lived contracted assets that can support future earnings over time. The stronger recent year-over-year revenue growth versus the sector suggests AES is still moving faster than many traditional utilities, even if the five-year revenue-per-share trend is modest.
Free cash flow remains the main tension in the growth case. AES has been spending heavily, and free cash flow has stayed negative, although the recent trend shows a meaningful improvement from the deepest outflows. For a company building generation and storage assets, negative free cash flow is not automatically a warning sign by itself; it can reflect an active investment cycle. The key question is whether those investments convert into durable earnings and cash generation once projects enter service.
One of the more important catalysts is the company’s position in renewable and storage development tied to rising U.S. power demand. Public company communications have emphasized a sizable pipeline and relationships with large commercial customers. In the current market, that combination can be valuable because data-center and technology customers increasingly want both reliable supply and low-carbon electricity. If AES continues bringing projects online on schedule, this could support earnings visibility over the next several years.
There is also a policy tailwind in the broader market. Tax credits and other support mechanisms for clean energy and storage have improved project economics in the United States. For AES, that can enhance returns on new projects and widen the addressable market, provided policy support remains durable and project execution stays on track.
Risks
This article is for informational purposes only and does not constitute financial advice. Some content is AI-generated. See Disclaimer


