Stock Analysis · Ameren Corp (AEE)
Overview
Ameren is a regulated electric and natural gas utility serving customers mainly in Missouri and Illinois. In simple terms, it owns and operates power plants, transmission lines, distribution networks, and gas infrastructure, then earns revenue by delivering electricity and gas to homes, businesses, and industrial users. Because most of its business is regulated, its earnings are shaped less by fast-changing consumer demand and more by customer growth, infrastructure investment, and decisions from state and federal regulators.
The company reports through regulated utility operations in Missouri and Illinois, with electric service clearly dominating the business and natural gas playing a smaller but still meaningful role. Based on recent annual reporting and segment disclosures, Ameren’s revenue mix can be summarized approximately as follows:
- Missouri electric operations: about 55% to 60% of revenue. This includes power generation, transmission, and local electricity delivery through Ameren Missouri.
- Illinois electric delivery: about 30% to 35% of revenue. This is mainly the regulated transmission and distribution utility business at Ameren Illinois.
- Illinois natural gas delivery: about 8% to 12% of revenue. This includes regulated gas distribution to customers in Illinois.
That mix matters because electric utilities usually have larger capital plans and more room for earnings growth through grid investments than gas-only networks. Ameren’s business is therefore tied heavily to rate base growth: when it invests in transmission, distribution, and generation assets that regulators allow into rates, the company can expand earnings over time.
Over the last several years, revenue and operating income have generally moved upward, while interest expense has also climbed. That combination fits the profile of a utility in a heavy investment cycle: larger infrastructure spending can support future earnings, but it also raises financing costs in the near term.
Key Figures
| Metric | Value | Sector ⓘ |
|---|---|---|
| Date | Oct 17, 2026 | |
| Context | ||
| Sector | Utilities | |
| Industry | Utilities - Regulated Electric | |
| Market Cap ⓘ | $28.88B | |
| Beta ⓘ | 0.45 | |
Value (Cheapness) | ||
| P/E Ratio ⓘ | 18.37 | 17.28 |
| P/B Ratio ⓘ | 2.13 | 1.51 |
| FCF Yield ⓘ | -4.87% | 0.65% |
| Dividend Yield ⓘ | 2.83% | 3.77% |
| EBIT / EV ⓘ | 5.16% | 5.01% |
| PEG ⓘ | 2.50 | |
Growth (Business expansion) | ||
| Revenue Growth ⓘ | -6.20% | 6.10% |
| RPS Growth (5Y CAGR) ⓘ | 6.83% | 3.87% |
| EPS Growth (5Y CAGR) ⓘ | -13.44% | -11.30% |
| BVPS Growth (5Y CAGR) ⓘ | 7.03% | 4.23% |
| Margin Growth (5Y Trend) ⓘ | 2.96% | 3.57% |
| FCF Growth (5Y CAGR) ⓘ | -18.51% | -8.84% |
| DPS Growth (5Y CAGR) ⓘ | 6.50% | 4.84% |
Quality (Business durability) | ||
| ROIC (Latest) ⓘ | N/A | 6.53% |
| ROA (Latest) ⓘ | 3.17% | 3.20% |
| ROIC (5Y Median) ⓘ | 6.16% | 5.95% |
| ROA (5Y Median) ⓘ | 2.92% | 2.75% |
| Net Debt / EBIT (Latest) ⓘ | 8.55 | 7.13 |
| Net Debt / EBIT (5Y Median) ⓘ | 8.66 | 7.23 |
| Net Debt / EBITDA (Latest) ⓘ | 5.14 | 4.31 |
| Net Debt / Assets ⓘ | 42.56% | 38.42% |
| EBITDA / Interest ⓘ | 5.12 | 4.58 |
| Operating Margin (Latest) ⓘ | 29.15% | 20.83% |
| Operating Margin (5Y Median) ⓘ | 25.36% | 20.08% |
| Debt to Equity (Latest) ⓘ | 159.33% | 137.69% |
| Profit Margin (Latest) ⓘ | 18.58% | 11.37% |
| Free Cash Flow (Latest) ⓘ | -$1.41B | |
Momentum (Price trend) | ||
| 3Y Return ⓘ | +47.05% | +52.37% |
| 12M Return (excl. last month) ⓘ | +6.09% | +8.84% |
| 6M Return ⓘ | -5.18% | -3.95% |
| Price vs. 200-Day MA ⓘ | -2.02% | -0.79% |
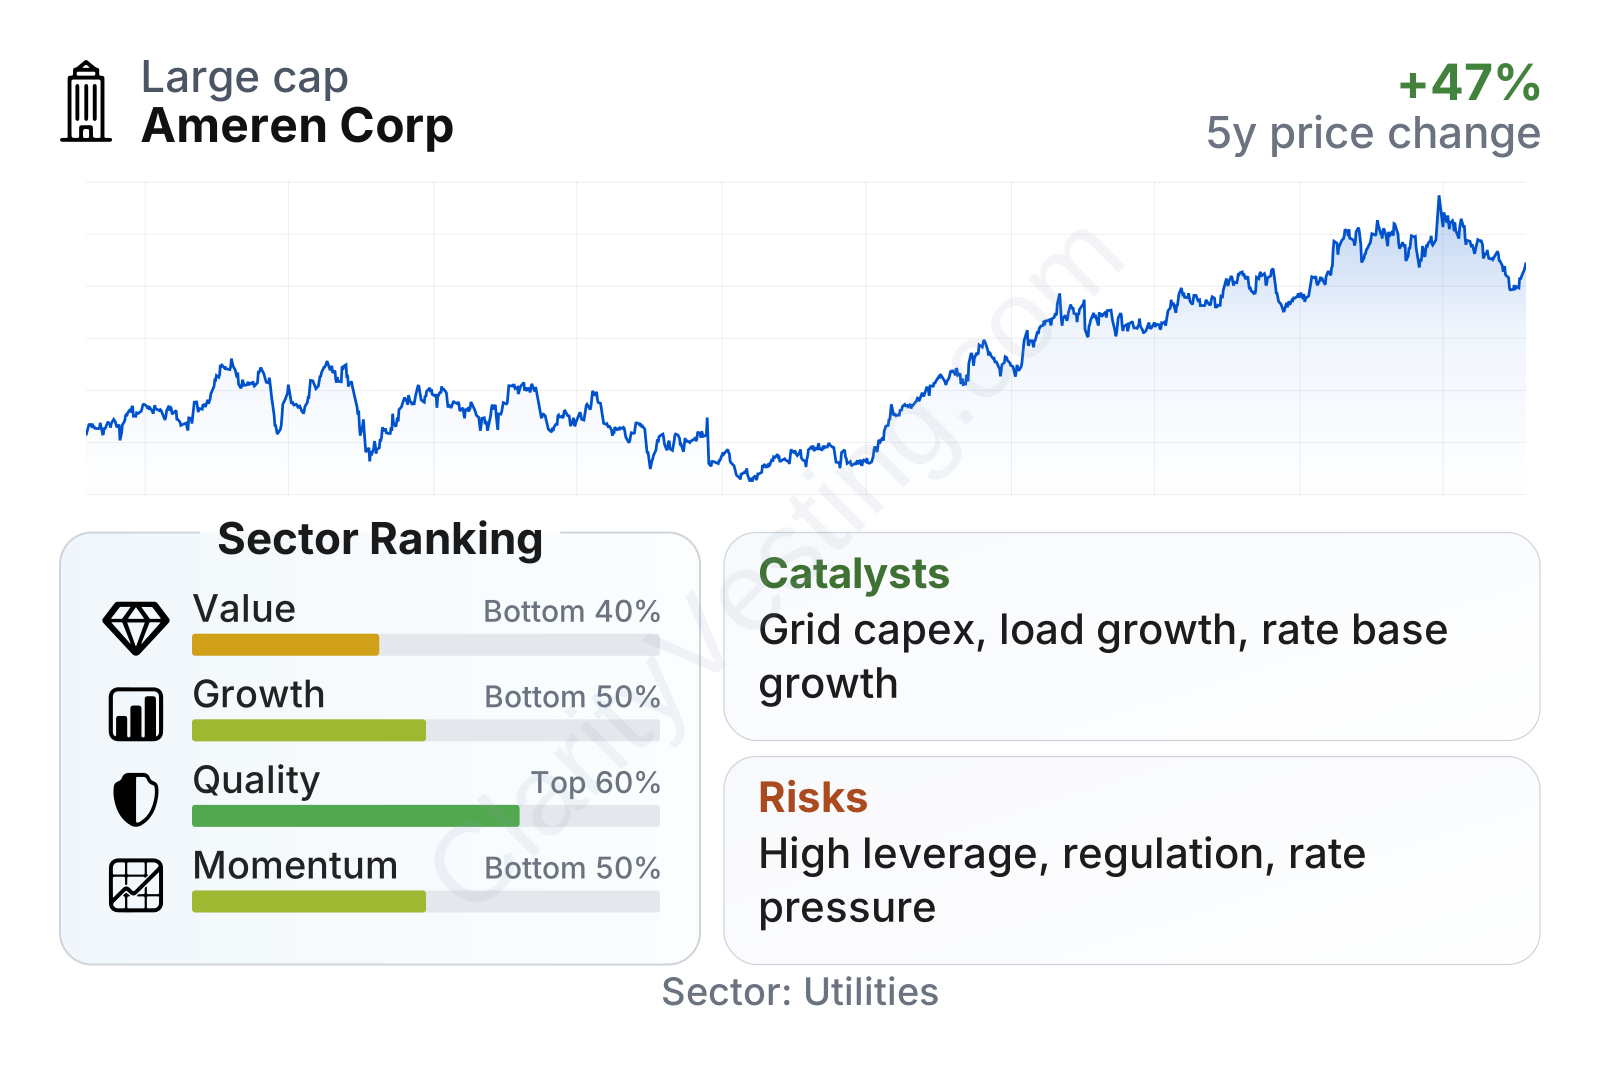
Ameren is a large utility with unusually low share-price volatility, reflected in a beta well below 1. Its quality profile looks solid relative to the sector, helped by operating and profit margins that run above many peers. Growth and momentum are less impressive, while valuation looks close to the middle of the pack rather than clearly cheap. One important point behind several metrics is cash flow: free cash flow is currently negative, which is common for capital-intensive utilities but still worth watching because it usually means external funding is needed to support expansion.
The stock chart also shows a business that has behaved more like a defensive utility than a high-growth company. After a weaker stretch in 2023 and 2024, the shares recovered strongly into 2025 and remained near elevated levels in 2026, suggesting the market has rewarded the company’s steady earnings profile and regulated investment outlook.
Growth
Ameren operates in a sector with long-term structural support. Electric utilities are at the center of grid modernization, reliability upgrades, renewable integration, and rising power demand from data centers, manufacturing reshoring, and electrification. This is not a rapid-growth industry in the way technology can be, but it can deliver durable, visible expansion when regulators allow utilities to earn returns on new infrastructure.
Ameren’s strategy is built around that exact model. The company has been investing heavily in transmission and distribution systems, cleaner generation, and grid resilience across Missouri and Illinois. This approach makes strategic sense because transmission and delivery assets often provide predictable regulated returns and can support earnings growth for many years.
Revenue per share has trended upward over the last five years despite some annual fluctuations, which suggests that Ameren has been expanding the economic base of the business rather than simply standing still. That is a useful sign for a utility, where long-term value creation often depends more on steady asset growth than on sudden jumps in demand.
Free cash flow has remained negative, but for a utility that is not automatically a red flag. In many cases it reflects large capital expenditures on projects that will be added to the regulated asset base later. The key question is whether these projects are prudent, approved, and likely to earn acceptable returns. For Ameren, the broad answer appears to be yes, although the scale of spending means execution matters.
A recent and important catalyst is the continuing buildout of transmission and grid infrastructure in its service territories, especially where reliability and renewable integration require major upgrades. Ameren has also highlighted longer-term demand opportunities connected to economic development and electricity-intensive customers in the Midwest. If those trends translate into higher load growth than utilities have seen historically, Ameren’s existing investment plan could gain additional support.
Another favorable point is the company’s dividend growth record. While this article does not focus on income, dividend growth of roughly 6% annually over five years shows management has been able to raise shareholder payouts while still funding a large capital plan. In a regulated utility, that often signals confidence in future earnings visibility.
Risks
This article is for informational purposes only and does not constitute financial advice. Some content is AI-generated. See Disclaimer


