Stock Analysis · ADMA Biologics Inc (ADMA)
Overview
ADMA Biologics is a specialized plasma-derived biopharmaceutical company. In simple terms, it collects human plasma, turns that plasma into immune-based therapies, and sells those therapies mainly for patients with weakened immune systems or certain infectious disease risks. The company also operates plasma collection centers, which helps support its own manufacturing needs.
Its business is more focused than many larger biotech companies. Rather than trying to develop a broad pipeline of experimental drugs, ADMA is centered on already commercialized plasma-derived products and on improving supply, production yields, and product mix. That makes the business easier to understand: collect plasma, manufacture high-value immunoglobulin products, and sell them into a medically necessary market.
The main revenue sources appear to be the following:
- Commercial product sales: approximately 90%+ of revenue. This includes the company’s plasma-derived therapies such as BIVIGAM, ASCENIV, and Nabi-HB. These are the core earnings drivers and the main reason revenue and profitability have improved so sharply.
- Plasma collection and other service-related revenue: low single-digit to high single-digit percentage depending on the period. This incorporates plasma center operations and smaller ancillary revenue streams tied to the company’s vertically integrated model.
Within product sales, ADMA does not publicly break out every product contribution in a simple percentage format each quarter, but filings and company commentary make clear that immunoglobulin products are the dominant source, with ASCENIV and BIVIGAM particularly important. Nabi-HB is also meaningful, though smaller than the immunoglobulin franchise.
What stands out in the economics of the business is how much the company has changed in a few years. Revenue expanded from about $81 million in 2021 to about $510 million in 2025, while the cost structure improved enough to move ADMA from heavy losses to strong profitability. That shift suggests the business is now benefiting from scale rather than just growing sales without operating leverage.
The financial progression shows a major transformation: revenue has multiplied several times since 2021, gross profit has widened substantially, and operating income moved from deeply negative territory to very strong positive levels by 2024 and 2025. Selling expenses rose, but much more slowly than revenue, which is a favorable sign for a maturing commercial platform.
Key Figures
| Metric | Value | Sector ⓘ |
|---|---|---|
| Date | Oct 03, 2026 | |
| Context | ||
| Sector | Healthcare | |
| Industry | Biotechnology | |
| Market Cap ⓘ | $2.25B | |
| Beta ⓘ | 0.77 | |
Value (Cheapness) | ||
| P/E Ratio ⓘ | 14.33 | 24.06 |
| P/B Ratio ⓘ | 5.60 | 3.08 |
| FCF Yield ⓘ | 5.18% | 3.07% |
| Dividend Yield ⓘ | N/A | 2.05% |
| EBIT / EV ⓘ | 10.07% | 0.63% |
| PEG ⓘ | N/A | |
Growth (Business expansion) | ||
| Revenue Growth ⓘ | 2.00% | 7.50% |
| RPS Growth (5Y CAGR) ⓘ | 37.67% | 8.70% |
| EPS Growth (5Y CAGR) ⓘ | N/A | -18.20% |
| BVPS Growth (5Y CAGR) ⓘ | 17.82% | 3.95% |
| Margin Growth (5Y Trend) ⓘ | N/A | -0.58% |
| FCF Growth (5Y CAGR) ⓘ | N/A | 0.88% |
| DPS Growth (5Y CAGR) ⓘ | N/A | 6.80% |
Quality (Business durability) | ||
| ROIC (Latest) ⓘ | 31.32% | 3.29% |
| ROA (Latest) ⓘ | 26.97% | 3.02% |
| ROIC (5Y Median) ⓘ | -0.89% | 4.75% |
| ROA (5Y Median) ⓘ | -8.33% | 1.93% |
| Net Debt / EBIT (Latest) ⓘ | 0.30 | 1.33 |
| Net Debt / EBIT (5Y Median) ⓘ | N/A | 1.83 |
| Net Debt / EBITDA (Latest) ⓘ | 0.29 | 0.99 |
| Net Debt / Assets ⓘ | 9.91% | 5.33% |
| EBITDA / Interest ⓘ | 26.61 | 9.63 |
| Operating Margin (Latest) ⓘ | 43.98% | 9.25% |
| Operating Margin (5Y Median) ⓘ | -1.24% | 7.80% |
| Debt to Equity (Latest) ⓘ | 49.94% | 28.99% |
| Profit Margin (Latest) ⓘ | 32.98% | 3.60% |
| Free Cash Flow (Latest) ⓘ | $116.47M | |
Momentum (Price trend) | ||
| 3Y Return ⓘ | +181.30% | +37.48% |
| 12M Return (excl. last month) ⓘ | -45.94% | +20.85% |
| 6M Return ⓘ | +9.00% | +9.73% |
| Price vs. 200-Day MA ⓘ | -15.85% | +4.69% |
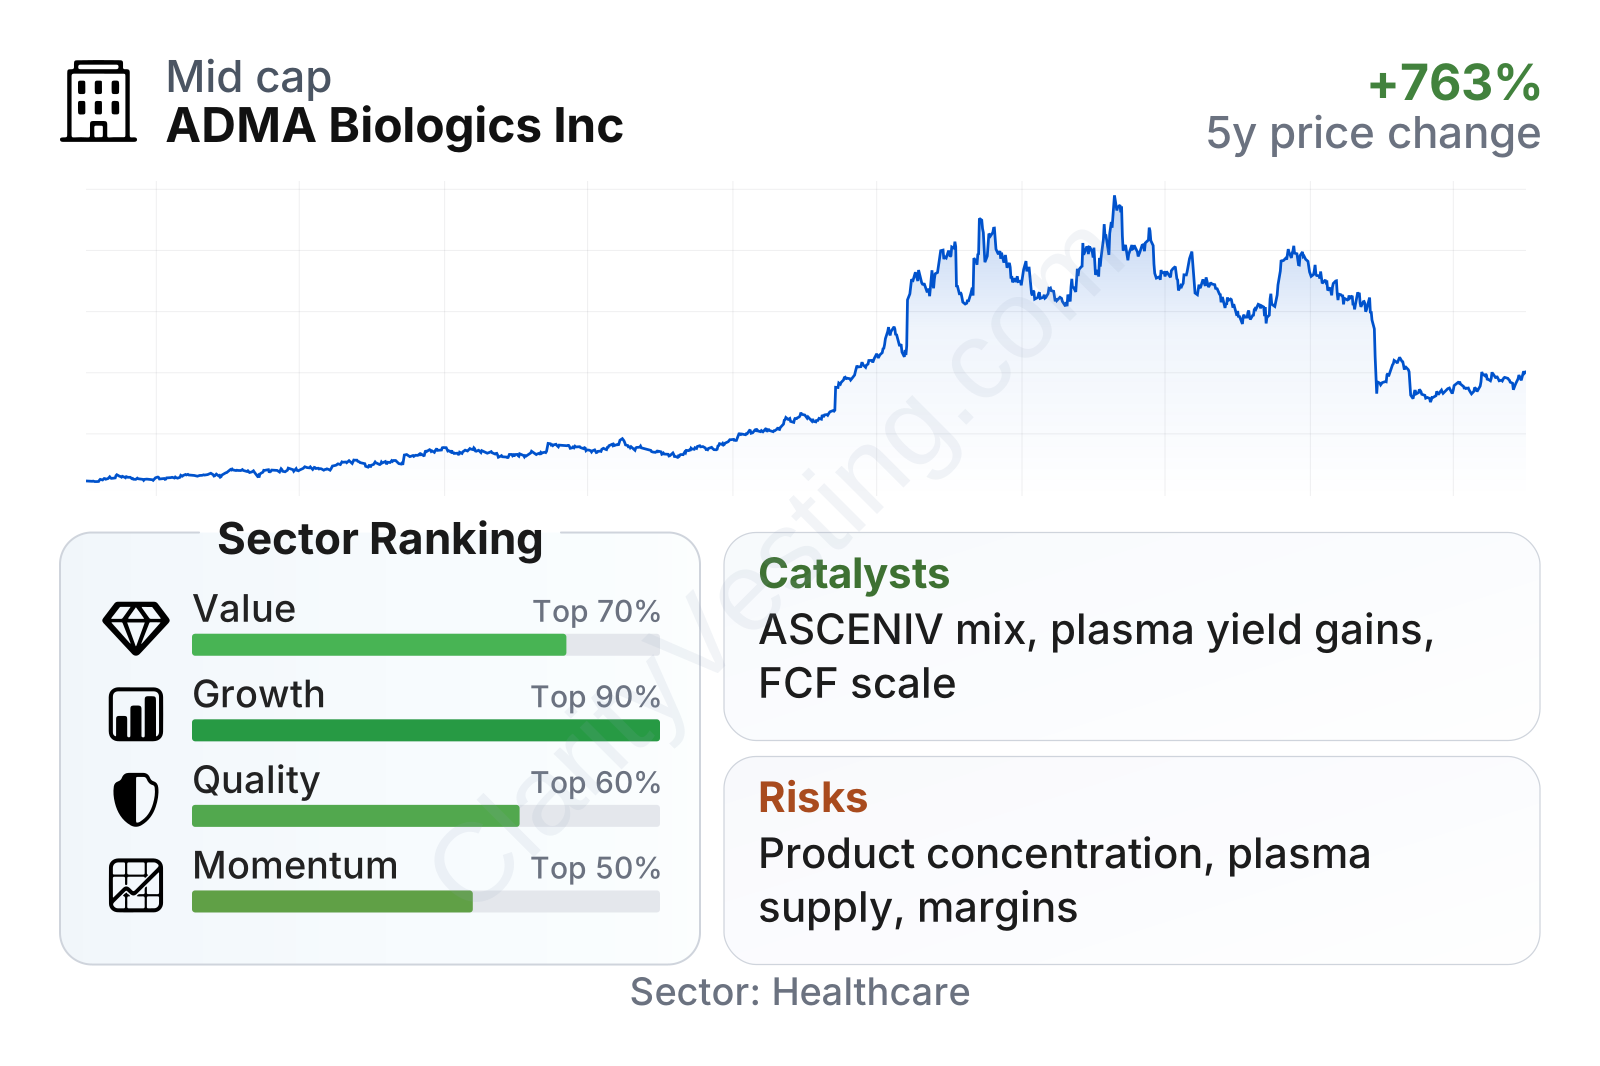
ADMA currently screens as unusually strong on growth and profitability relative to much of the healthcare and biotechnology universe. Returns on capital and assets are far above sector medians, free cash flow generation has become meaningful, and earnings-based valuation looks lower than the typical peer. The main weaker area is recent momentum: after a very strong multiyear share price run, the stock has gone through a sizable reset, which often reflects changing expectations after a period of exceptional growth.
The longer-term stock chart still shows how dramatic the re-rating has been. Shares moved from roughly $1 to above $20 at their peak before retreating sharply in 2026. That pattern usually means the market first recognized a major operational turnaround, then became more cautious about how much future growth was already reflected in the price.
Growth
ADMA operates in a favorable niche of healthcare. Plasma-derived therapies serve chronic and medically necessary indications, and demand for immunoglobulin products has generally remained resilient. This is not a hype-driven market; it is supported by real clinical need, recurring treatment patterns, and high manufacturing complexity. Those traits can support durable growth for companies that secure supply and execute well.
ADMA’s strategy is logical for that market. Instead of relying mainly on risky early-stage drug development, management has focused on vertical integration, expanding plasma sourcing, improving manufacturing output, and prioritizing higher-value products. That matters because in plasma-derived medicine, access to raw plasma and efficient production can be just as important as demand.
Revenue growth has cooled sharply from the extraordinary rates seen in 2022 through 2025. Earlier periods frequently showed year-over-year growth well above 40%, and often much higher, while more recent quarters have been near flat to low single-digit growth. That does not necessarily mean the business has stalled. It more likely means ADMA is now being compared against a much larger revenue base after several years of exceptional expansion.
One of the most important changes is cash generation. Free cash flow was negative not long ago, then turned decisively positive and crossed above $100 million on a trailing basis. For a company that previously depended on external capital and carried turnaround risk, this is a major shift. It gives ADMA more flexibility to invest in manufacturing, balance sheet repair, and product optimization without relying as heavily on financing markets.
A notable growth catalyst is the company’s effort to improve plasma yield and product mix, including the use of its ADMAlytics analytics platform and manufacturing initiatives designed to extract more value from each liter of plasma. In practical terms, that can raise revenue and margins even if plasma volumes do not grow at the same pace as before.
Another catalyst is industry structure. Plasma-derived products face meaningful barriers to entry because supply chains, donor networks, fractionation know-how, regulatory compliance, and manufacturing quality all matter. If ADMA continues to execute, it can benefit from a market where capacity is difficult to build quickly.
Recent company communications have also highlighted continued confidence in commercial demand and operational efficiency. The most significant opportunity is not just selling more product, but sustaining premium economics on a broader base of production.
Risks
This article is for informational purposes only and does not constitute financial advice. Some content is AI-generated. See Disclaimer


