Stock Analysis · Auckland International Airport Limited (ACKDF)
Overview
Auckland International Airport Limited operates New Zealand’s largest airport gateway. The company owns and runs Auckland Airport, which is the main international entry point into the country and also an important domestic hub. Its business is broader than aircraft movements alone: it earns money from airline and passenger activity, retail and parking inside the airport precinct, and a substantial property portfolio tied to the airport site.
The business model is attractive for long-term analysis because an airport can combine infrastructure-like characteristics with multiple revenue streams. Passenger traffic supports aeronautical charges, while the same traffic also feeds shops, food outlets, car parking, lounges, and commercial property demand. That creates a layered earnings base rather than reliance on a single fee.
Based on the company’s recent annual reporting structure, revenue is mainly generated from the following areas:
- Aeronautical revenue: approximately 50% to 55% of revenue. This includes charges paid by airlines and other airport users for aircraft landing, terminal use, airfield services, and passenger-related fees.
- Retail and other passenger-related revenue: approximately 20% to 25%. This typically includes duty free, specialty retail, food and beverage, parking, transport access, lounges, and other services linked to traveler activity.
- Property and commercial rental income: approximately 20% to 25%. This comes from land leases, warehouses, offices, logistics facilities, hotels, and other commercial assets located on airport land.
Auckland Airport’s mix matters because it reduces dependence on any one line item. Aeronautical income is tied to regulated and contracted airport use, retail benefits from higher passenger spending, and property income can add a steadier cash component over time.
Revenue has recovered sharply since the pandemic period, rising from roughly NZ$282 million in fiscal 2022 to just over NZ$1.0 billion in fiscal 2026. Profitability also improved materially after the travel reopening, although earnings can still move around due to financing costs, taxes, and heavy capital spending tied to expansion.
The long-term trend is clear: revenue has more than tripled from the depressed 2022 level, and operating income has recovered strongly. The business now looks much closer to a normalized post-reopening airport operator, even if construction spending is still weighing on free cash flow.
Key Figures
| Metric | Value | Sector ⓘ |
|---|---|---|
| Date | Oct 24, 2026 | |
| Context | ||
| Sector | Industrials | |
| Industry | Airports & Air Services | |
| Market Cap ⓘ | $8.15B | |
| Beta ⓘ | 0.55 | |
Value (Cheapness) | ||
| P/E Ratio ⓘ | 43.45 | 22.29 |
| P/B Ratio ⓘ | 0.76 | 1.98 |
| FCF Yield ⓘ | -12.00% | 6.26% |
| Dividend Yield ⓘ | 2.94% | 1.92% |
| EBIT / EV ⓘ | N/A | 4.83% |
| PEG ⓘ | 32.71 | |
Growth (Business expansion) | ||
| Revenue Growth ⓘ | 2.70% | 9.30% |
| RPS Growth (5Y CAGR) ⓘ | 32.79% | 7.76% |
| EPS Growth (5Y CAGR) ⓘ | 0.92% | -13.17% |
| BVPS Growth (5Y CAGR) ⓘ | 3.55% | 6.13% |
| Margin Growth (5Y Trend) ⓘ | -33.13% | 0.74% |
| FCF Growth (5Y CAGR) ⓘ | N/A | 10.79% |
| DPS Growth (5Y CAGR) ⓘ | -9.63% | 9.41% |
Quality (Business durability) | ||
| ROIC (Latest) ⓘ | N/A | 10.75% |
| ROA (Latest) ⓘ | 5.33% | 5.41% |
| ROIC (5Y Median) ⓘ | 2.63% | 9.37% |
| ROA (5Y Median) ⓘ | 1.92% | 4.95% |
| Net Debt / EBIT (Latest) ⓘ | 2.64 | 2.04 |
| Net Debt / EBIT (5Y Median) ⓘ | 6.15 | 2.27 |
| Net Debt / EBITDA (Latest) ⓘ | 1.85 | 1.39 |
| Net Debt / Assets ⓘ | 18.35% | 19.27% |
| EBITDA / Interest ⓘ | 11.34 | 9.58 |
| Operating Margin (Latest) ⓘ | 51.76% | 10.49% |
| Operating Margin (5Y Median) ⓘ | 49.68% | 10.30% |
| Debt to Equity (Latest) ⓘ | 25.54% | 64.82% |
| Profit Margin (Latest) ⓘ | 33.63% | 6.67% |
| Free Cash Flow (Latest) ⓘ | -$977.94M | |
Momentum (Price trend) | ||
| 3Y Return ⓘ | +14.80% | +67.77% |
| 12M Return (excl. last month) ⓘ | +18.67% | +12.05% |
| 6M Return ⓘ | +2.83% | 0.00% |
| Price vs. 200-Day MA ⓘ | +4.79% | +0.67% |
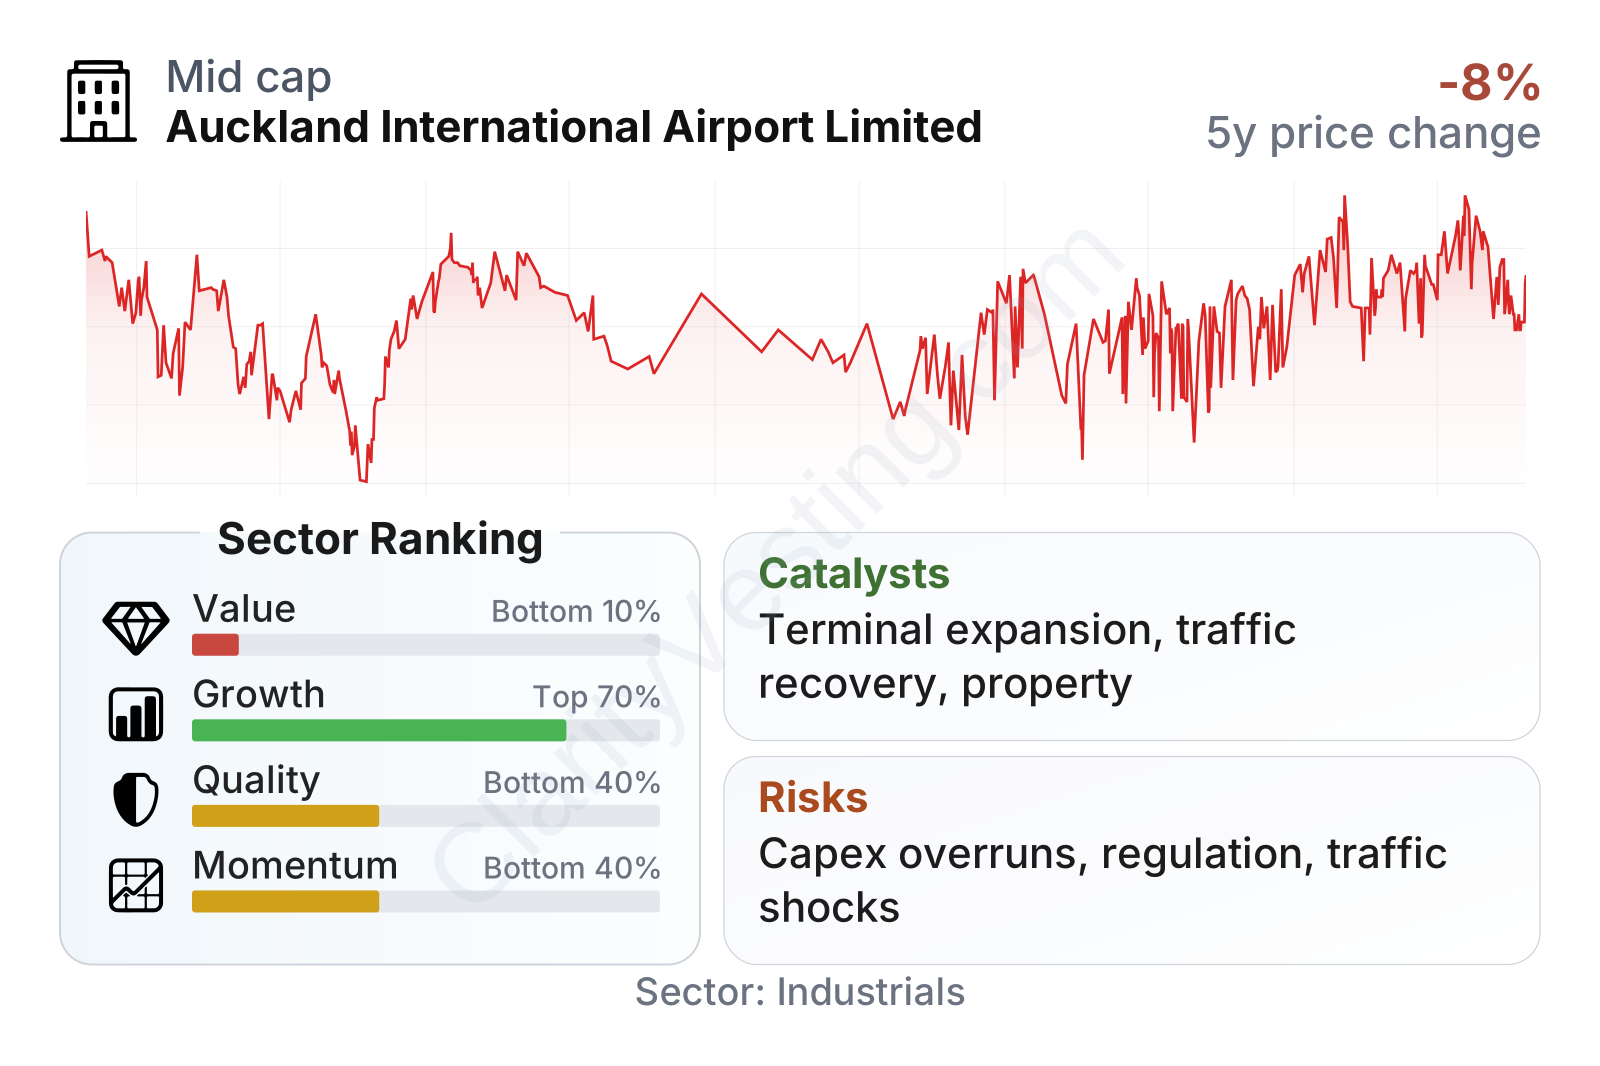
The company sits in a mixed position. Profitability is notably strong for the sector, with operating margin above 50% and profit margin well above industry medians, which reflects the economics of a large airport asset. Balance-sheet leverage looks manageable rather than excessive, with debt to equity around 26% and interest coverage above sector norms. On the other hand, value metrics look demanding: earnings multiples are high, free cash flow is currently negative, and the overall value profile ranks near the bottom of the sector. Growth metrics are uneven too—longer-term revenue expansion has been strong, but recent year-over-year growth is more modest and dividend growth over five years remains negative.
The stock performance also tells two stories at once. Over the last 12 months and 6 months, momentum has been better than the sector median, suggesting improving market confidence. Over a 3-year view, however, returns still trail much of the broader Industrials group, showing that the recovery has taken time to rebuild.
Growth
The company operates in a sector with long-term structural support. Air travel tends to grow over time with tourism, trade, migration, and business connectivity, and Auckland Airport is especially important because New Zealand’s geography makes air links critical. As the country’s main international airport, it is positioned to capture a large share of inbound visitor growth and a meaningful portion of domestic connecting traffic.
The company’s strategy also fits that backdrop. Management has been investing heavily in terminal redevelopment and wider airport infrastructure to increase capacity, improve resilience, and modernize the passenger experience. For a long-duration asset such as an airport, this matters because future growth is constrained not just by demand but by how many passengers and aircraft the site can process efficiently.
A second growth lever is the property platform. Airport land is scarce, strategically located, and attractive for logistics, freight, hospitality, and commercial uses. That gives Auckland Airport a way to grow beyond pure passenger volumes. Property development can deepen returns on land that already benefits from transport connectivity.
There are also visible catalysts. International traffic normalization has been a major tailwind since border reopening, and the company has continued to report higher revenue as activity recovered. Capacity projects under way can support additional airline movements and passenger throughput over time. New Zealand tourism remains an important macro driver as visitor flows continue rebuilding, especially on long-haul routes where Auckland plays a central role.
Recent company reporting also points to a large multi-year capital program centered on the domestic jet terminal and wider integrated terminal development. That is significant because it is not just maintenance spending; it is intended to expand the airport’s long-term operating base. If delivered well, it could support higher aeronautical income, better retail capture, and stronger commercial use of the precinct over many years.
Risks
This article is for informational purposes only and does not constitute financial advice. Some content is AI-generated. See Disclaimer


