Stock Analysis · American Bitcoin Corp (ABTC)
Overview
American Bitcoin Corp is a Bitcoin-focused company whose public-market profile is tied primarily to building exposure to digital assets rather than to a broad, diversified operating business. Based on the available public financial history under the ABTC listing, the company has gone through major shifts in scale, profitability, and balance-sheet structure, which makes it important to view it as a higher-volatility, transition-stage business rather than as a mature financial company.
Its reported revenue base has historically come from operating activities rather than from a large mix of recurring fee businesses. Public filings show revenue over recent years, but they do not provide a stable, easy-to-read segment split that would allow a precise percentage breakdown by business line for 2026. What is clear is that revenue has been relatively modest compared with the large swings seen in earnings and equity value, suggesting that non-recurring items, valuation changes, capital structure effects, and the economics of Bitcoin-related activities can have an outsized effect on results.
Using the latest available annual figures as a practical reference point, the company’s economic profile can be summarized this way:
- Primary operating revenue: the large majority of reported revenue, historically 100% of disclosed total revenue in the absence of a clearly separated segment breakdown.
- Non-operating and remeasurement effects: not a revenue line, but highly important for understanding net income volatility because these items appear to have had a much bigger effect on bottom-line results than revenue alone.
- Dividend income: 0% based on the available record; there is no indicated dividend yield.
The cost structure has also been unstable. Revenue improved materially from 2021 to 2025, but profits did not follow a straight path. The business moved from losses to a strong reported profit in 2024 and then back to a large loss in 2025. That pattern matters for long-term analysis because it suggests the company is still proving whether it can translate growth in activity into durable shareholder value.
The long-term pattern is less about steady expansion and more about sharp swings. Revenue rose meaningfully over five years, but profitability moved from losses to a one-year spike and then back into the red, which points to a business model still heavily exposed to changing market conditions and accounting effects.
Key Figures
| Metric | Value | Sector ⓘ |
|---|---|---|
| Date | Oct 17, 2026 | |
| Context | ||
| Sector | Financial Services | |
| Industry | Capital Markets | |
| Market Cap ⓘ | $1.03B | |
| Beta ⓘ | N/A | |
Value (Cheapness) | ||
| P/E Ratio ⓘ | N/A | 12.26 |
| P/B Ratio ⓘ | 0.87 | 1.23 |
| FCF Yield ⓘ | -13.47% | 10.40% |
| Dividend Yield ⓘ | N/A | 3.02% |
| EBIT / EV ⓘ | -22.46% | 8.14% |
| PEG ⓘ | N/A | |
Growth (Business expansion) | ||
| Revenue Growth ⓘ | 121.30% | 9.35% |
| RPS Growth (5Y CAGR) ⓘ | -94.77% | 12.19% |
| EPS Growth (5Y CAGR) ⓘ | N/A | -9.53% |
| BVPS Growth (5Y CAGR) ⓘ | -94.70% | 4.99% |
| Margin Growth (5Y Trend) ⓘ | N/A | -3.86% |
| FCF Growth (5Y CAGR) ⓘ | N/A | 4.81% |
| DPS Growth (5Y CAGR) ⓘ | N/A | 8.79% |
Quality (Business durability) | ||
| ROIC (Latest) ⓘ | -24.73% | 9.49% |
| ROE (Latest) ⓘ | -31.25% | 13.90% |
| ROA (Latest) ⓘ | -15.77% | 1.55% |
| ROIC (5Y Median) ⓘ | N/A | 7.86% |
| ROE (5Y Median) ⓘ | -35.78% | 12.17% |
| ROA (5Y Median) ⓘ | -13.02% | 1.30% |
| Net Debt / EBIT (Latest) ⓘ | N/A | 0.96 |
| Net Debt / EBIT (5Y Median) ⓘ | N/A | 0.73 |
| Net Debt / EBITDA (Latest) ⓘ | N/A | 0.92 |
| Operating Margin (Latest) ⓘ | -75.11% | 22.30% |
| Operating Margin (5Y Median) ⓘ | -90.12% | 24.63% |
| Debt to Equity (Latest) ⓘ | 11.34% | 58.56% |
| Profit Margin (Latest) ⓘ | -71.75% | 26.57% |
| Free Cash Flow (Latest) ⓘ | -$139.19M | |
Momentum (Price trend) | ||
| 3Y Return ⓘ | -97.57% | +88.33% |
| 12M Return (excl. last month) ⓘ | -93.32% | +19.38% |
| 6M Return ⓘ | -40.60% | +4.75% |
| Price vs. 200-Day MA ⓘ | -44.05% | +3.50% |
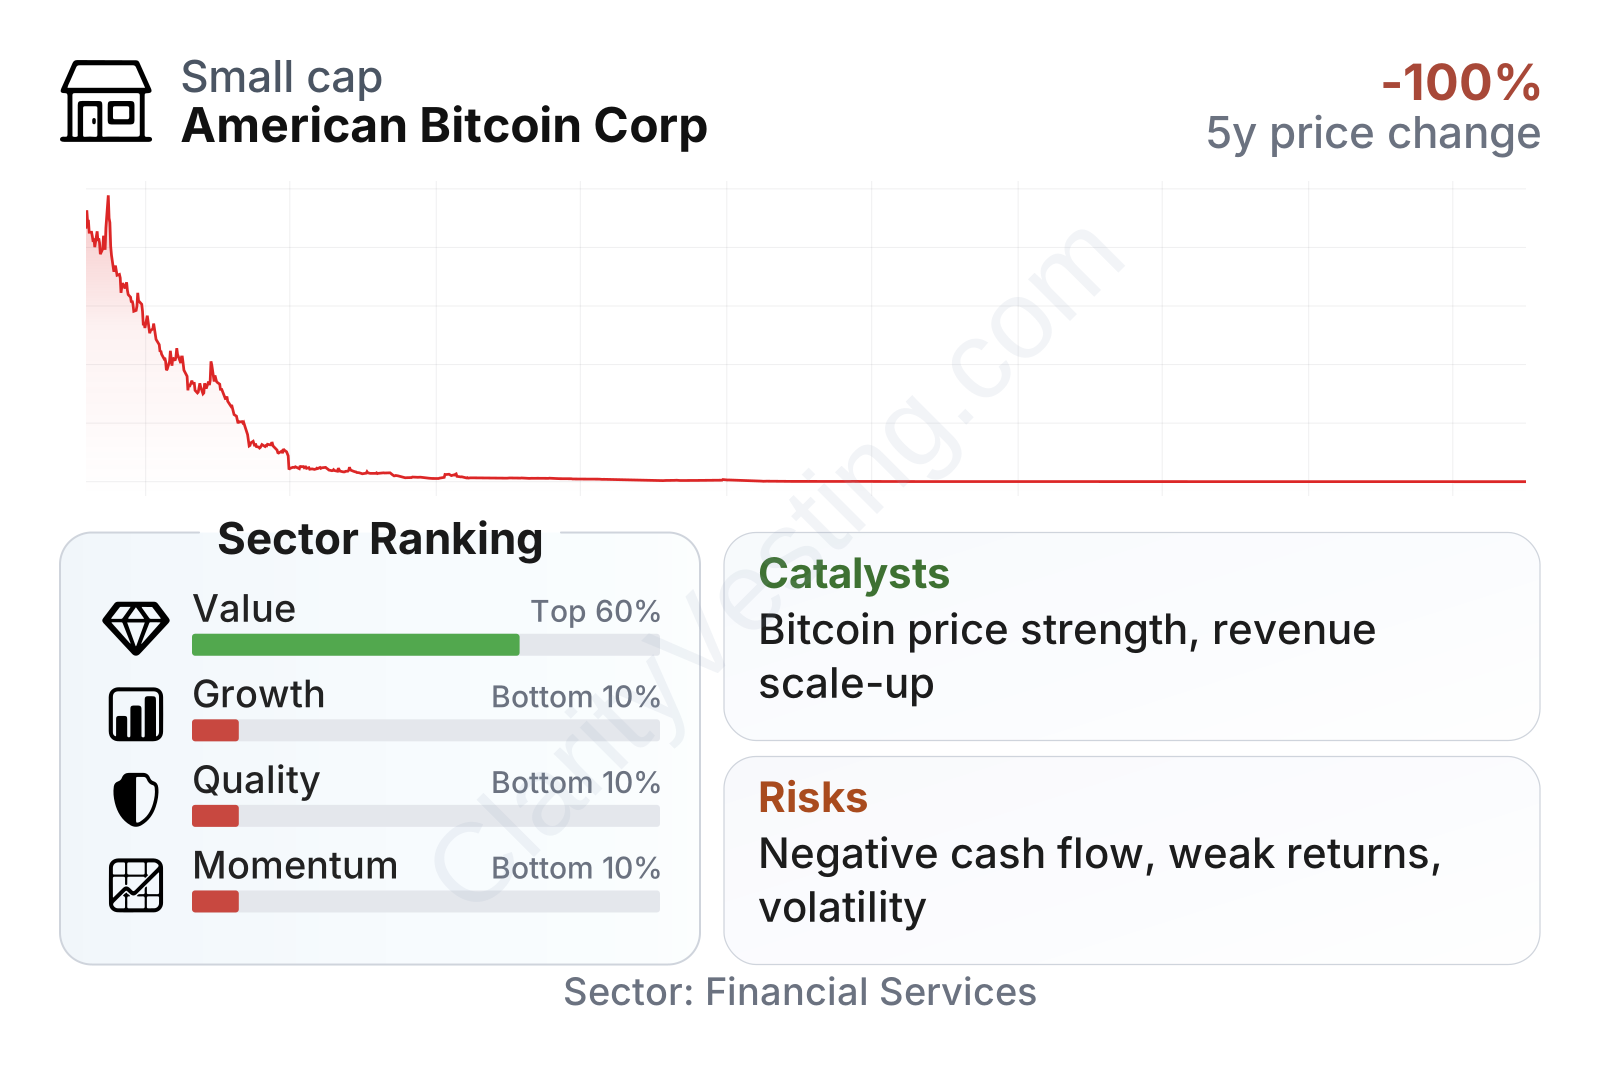
At a high level, the company is now a small-cap stock with weak overall operating quality compared with most firms in its sector. The most striking contrast is between very fast recent year-over-year revenue growth and very poor longer-term quality, profitability, and price performance. On valuation, the shares trade below sector median on price-to-book, but that discount comes with negative free cash flow, negative operating earnings, and weak momentum, so it should not be read as a simple sign of cheapness.
The share-price history shows extreme volatility rather than a stable compounding pattern. The stock has lost the vast majority of its value over the multi-year period shown, including a very steep drop over the last 12 months and over three years. For long-term readers, that kind of record usually signals a company where execution risk and market sentiment can overwhelm fundamentals for extended periods.
Growth
American Bitcoin Corp operates in a sector linked to digital assets, a space that can grow quickly when Bitcoin adoption, institutional participation, and market liquidity improve. That creates real upside potential if the company is positioned correctly. Bitcoin-related businesses can benefit from higher asset prices, stronger demand for infrastructure, greater mainstream acceptance, and a more favorable regulatory framework. In that sense, the broader arena remains attractive for growth, even though it is far from predictable.
The company’s recent revenue growth stands out. Year-over-year revenue expansion is far above the sector median, which shows the business has been able to increase activity quickly. That said, the longer historical record is less encouraging. Five-year trends in revenue per share and book value per share are deeply negative, meaning growth has not consistently translated into stronger value on a per-share basis. For long-term ownership, that distinction matters a lot: growth in the business is more meaningful when it survives dilution, losses, and financing pressure.
The earnings trend illustrates that instability. Reported earnings per share have remained negative and highly erratic, including a very large distortion in 2024 and continued losses afterward. This is not the pattern of a business that has already found a reliable operating formula. It is closer to a company still trying to align scale, capital structure, and profitability.
Book value per share also shows a turbulent path. After unusual swings, the latest levels are well below the peak reached during the recent restructuring period. That suggests the equity base has improved from distressed levels seen earlier, but it has not yet established a durable upward trend.
A potential catalyst is the simple economics of Bitcoin sensitivity. If Bitcoin prices rise and the company’s balance sheet, operating platform, or market identity are closely tied to that asset, the company could see stronger economics and a better ability to raise capital or expand. Another catalyst is strategic clarity: if management can simplify the business, stabilize margins, and prove that growth is not just cyclical but operationally repeatable, the market could begin to assess the company on more than short-term swings.
Recent public information also suggests a significant opportunity in visibility itself. A pure-play or near-pure-play Bitcoin identity can attract attention during periods when digital assets return to the center of capital markets. For a small-cap name, that can matter because access to capital and investor awareness often shape future options almost as much as current income statements do.
Risks
This article is for informational purposes only and does not constitute financial advice. Some content is AI-generated. See Disclaimer


