Stock Analysis · ABM Industries Incorporated (ABM)
Overview
ABM Industries Incorporated is a facility services company. In simple terms, it helps large buildings and campuses operate every day. Its work includes janitorial services, engineering and maintenance, parking, electrical and lighting work, HVAC support, landscaping, and other services that keep offices, airports, hospitals, schools, data centers, manufacturing sites, and entertainment venues running.
ABM’s business model is mostly based on recurring service contracts. That makes revenue less dependent on one-time projects than many other industrial companies. Customers typically outsource these tasks because they are labor-intensive, need local staffing, and must be performed consistently across many sites.
Based on the company’s recent annual reporting, revenue is mainly organized by industry group rather than by a single product line.
- Business & Industry: approximately 35% to 40% of revenue. This includes office buildings, commercial real estate, manufacturing, distribution, and other general business facilities.
- Manufacturing & Distribution: approximately 20% to 25%. This serves warehouses, logistics facilities, and industrial sites that need maintenance, cleaning, and operational support.
- Aviation: approximately 15% to 20%. This includes airport janitorial, passenger assistance, parking, and other aviation-related facility services.
- Education: approximately 10% to 15%. This covers K-12 schools, colleges, and universities.
- Technical Solutions: approximately 10% to 15%. This includes electrical power, lighting, energy solutions, and infrastructure-related project work.
The broad mix matters because no single end market appears dominant enough to define the whole company. At the same time, the business remains concentrated in labor-heavy outsourced services, which means scale and execution are more important than product innovation.
Over the last several years, revenue has trended upward, but profitability has been uneven. Gross profit has remained meaningful, yet a large share of sales is absorbed by direct labor and operating costs. That is normal for this type of service company, but it also explains why even modest execution problems can have a visible impact on earnings.
ABM has grown to the high end of the mid-cap range, with annual sales now well above where they stood a few years ago. The key takeaway from the business mix is that it is a large, diversified operator in essential building services rather than a fast-changing technology company.
Key Figures
| Metric | Value | Sector ⓘ |
|---|---|---|
| Date | Oct 03, 2026 | |
| Context | ||
| Sector | Industrials | |
| Industry | Specialty Business Services | |
| Market Cap ⓘ | $2.85B | |
| Beta ⓘ | 0.67 | |
Value (Cheapness) | ||
| P/E Ratio ⓘ | 17.74 | 22.45 |
| P/B Ratio ⓘ | 1.59 | 1.98 |
| FCF Yield ⓘ | 10.96% | 6.31% |
| Dividend Yield ⓘ | 2.32% | 1.96% |
| EBIT / EV ⓘ | 6.92% | 4.81% |
| PEG ⓘ | 2.25 | |
Growth (Business expansion) | ||
| Revenue Growth ⓘ | 4.20% | 9.10% |
| RPS Growth (5Y CAGR) ⓘ | 11.09% | 7.75% |
| EPS Growth (5Y CAGR) ⓘ | -7.16% | -13.59% |
| BVPS Growth (5Y CAGR) ⓘ | 4.74% | 6.22% |
| Margin Growth (5Y Trend) ⓘ | 0.31% | 0.72% |
| FCF Growth (5Y CAGR) ⓘ | -13.73% | 10.98% |
| DPS Growth (5Y CAGR) ⓘ | 8.68% | 9.48% |
Quality (Business durability) | ||
| ROIC (Latest) ⓘ | 7.06% | 10.92% |
| ROA (Latest) ⓘ | 3.01% | 5.41% |
| ROIC (5Y Median) ⓘ | 7.22% | 9.21% |
| ROA (5Y Median) ⓘ | 3.08% | 4.94% |
| Net Debt / EBIT (Latest) ⓘ | 5.46 | 2.07 |
| Net Debt / EBIT (5Y Median) ⓘ | 4.51 | 2.28 |
| Net Debt / EBITDA (Latest) ⓘ | 4.05 | 1.43 |
| Net Debt / Assets ⓘ | 31.63% | 19.27% |
| EBITDA / Interest ⓘ | 4.13 | 9.53 |
| Operating Margin (Latest) ⓘ | 3.55% | 10.50% |
| Operating Margin (5Y Median) ⓘ | 3.68% | 10.27% |
| Debt to Equity (Latest) ⓘ | 105.13% | 65.48% |
| Profit Margin (Latest) ⓘ | 1.82% | 6.62% |
| Free Cash Flow (Latest) ⓘ | $312.30M | |
Momentum (Price trend) | ||
| 3Y Return ⓘ | +28.55% | +58.56% |
| 12M Return (excl. last month) ⓘ | -2.64% | +15.63% |
| 6M Return ⓘ | +26.64% | +4.19% |
| Price vs. 200-Day MA ⓘ | +10.08% | +0.93% |
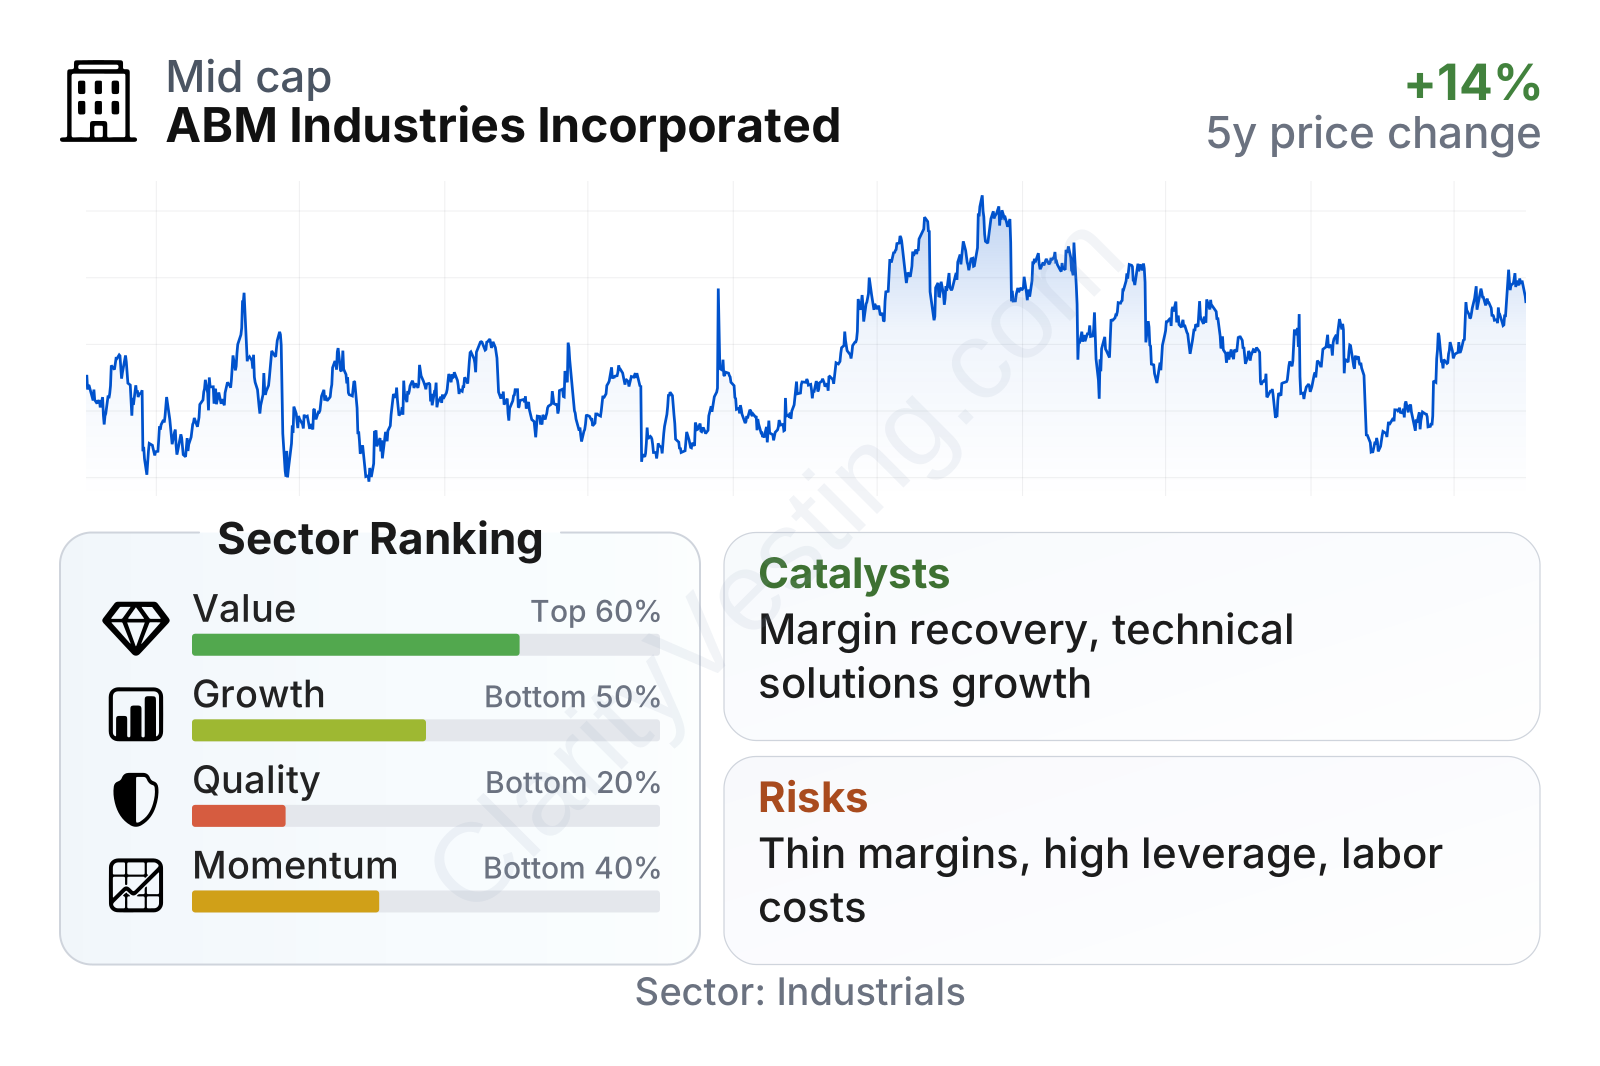
ABM’s current profile looks mixed. On valuation measures, it screens somewhat cheaper than the typical company in its sector, with a lower earnings multiple and price-to-book ratio, while free cash flow yield stands out as relatively strong. The company also has a lower-beta share price profile than many industrial names, which suggests less volatility than the broader market.
At the same time, quality and growth indicators are less impressive. Revenue is still expanding, but recent year-over-year growth has been below the sector median. Profitability is also thin for the industry, with returns on assets and invested capital trailing many peers. In short, the numbers point to a business that is stable and cash-generative, but not especially high-margin or high-return.
Growth
ABM operates in a sector with durable long-term demand. Buildings, airports, schools, hospitals, data centers, and distribution centers all need cleaning, maintenance, energy support, and operational staffing regardless of the economic cycle. That gives the company exposure to a service category that is essential rather than optional.
The more attractive part of the growth case is not basic cleaning alone, but the steady expansion of outsourced integrated facility management. Large customers increasingly prefer to use one provider across many locations instead of managing separate local vendors. ABM’s national scale, broad service menu, and long operating history fit that trend.
Revenue growth has cooled from the unusually strong period seen after the pandemic recovery, but the more recent pattern still shows steady low- to mid-single-digit expansion, with some quarters moving higher. That suggests the company is still winning business and passing through some pricing, even if it is not growing at the pace of faster industrial service peers.
Another possible growth driver is energy efficiency and technical infrastructure work. Through its technical solutions capabilities, ABM can benefit from demand tied to electrical upgrades, lighting retrofits, microgrids, EV charging, and broader facility modernization. This is important because project and technical work can deepen customer relationships and may offer better economics than standard janitorial contracts.
Management has also emphasized sectors such as aviation, manufacturing, distribution, and data-center-related support, where demand can be more resilient and where operational complexity tends to favor larger providers. If that mix continues to improve, it could support better contract quality over time.
Cash generation has been volatile, but the latest trailing twelve-month level is much better than the weakest periods of the past few years. That matters because for a labor-intensive services company, stronger cash conversion creates more flexibility for debt reduction, dividends, acquisitions, and contract investments.
Recent company updates in 2026 have continued to point to ongoing contract activity, operating discipline, and attention to margin recovery rather than a dramatic strategic shift. The opportunity appears more operational than transformational: improving execution in a steady-demand industry.
Risks
This article is for informational purposes only and does not constitute financial advice. Some content is AI-generated. See Disclaimer


