Stock Analysis · Abcellera Biologics Inc (ABCL)
Overview
Abcellera Biologics is a biotechnology company focused on discovering antibodies for drug developers. In simple terms, it helps pharmaceutical and biotech partners find promising antibody candidates faster by combining laboratory biology, large-scale data analysis, and artificial intelligence tools. Its business model is not built around selling a large commercial drug portfolio today. Instead, it earns money by providing discovery services, licensing its technology and antibody assets, and potentially collecting milestone payments and royalties when partnered drug programs advance.
This makes Abcellera different from a traditional profitable drug company. It is closer to a platform business inside biotechnology: it builds a discovery engine, signs partners, supports programs through early development, and then shares in the value if some of those programs succeed. The attraction of that model is scalability. The difficulty is timing, because revenue can swing sharply depending on when milestones are earned and how partner programs progress.
Based on the company’s recent filings, revenue is mainly tied to collaboration agreements and can be uneven from year to year. The broad sources of revenue can be summarized as follows:
- Research fees and collaboration revenue: payments from partners for discovery work, platform access, and scientific services. In recent years this appears to represent the majority of recurring revenue.
- License revenue and option-related payments: amounts linked to rights granted on antibody candidates, platform technologies, or development options. This can be meaningful in periods with new or expanded deals.
- Milestone revenue: payments triggered when partnered programs hit technical, preclinical, clinical, or regulatory targets. This source can be large in a given period but is inherently irregular.
- Royalties and downstream economics: a smaller current contributor, but strategically important because it could become much larger if partnered drugs reach the market.
Revenue concentration remains high because a relatively small number of partnerships can drive a large share of annual results. That helps explain why Abcellera’s sales surged in one year and then fell sharply afterward. The business is therefore best understood through the size and quality of its program pipeline rather than through smooth year-to-year sales trends alone.
The long-term pattern is clear: 2022 was an exceptional revenue year, while 2023 through 2025 reflected a much lower base and heavy ongoing spending on research and platform expansion. Even with some recovery in 2025, operating costs remained far above revenue, showing that Abcellera is still funding future capacity rather than harvesting mature profits.
Key Figures
| Metric | Value | Sector ⓘ |
|---|---|---|
| Date | Oct 03, 2026 | |
| Context | ||
| Sector | Healthcare | |
| Industry | Biotechnology | |
| Market Cap ⓘ | $4.73B | |
| Beta ⓘ | 1.32 | |
Value (Cheapness) | ||
| P/E Ratio ⓘ | N/A | 24.06 |
| P/B Ratio ⓘ | 4.74 | 3.08 |
| FCF Yield ⓘ | -3.80% | 3.07% |
| Dividend Yield ⓘ | N/A | 2.05% |
| EBIT / EV ⓘ | -5.62% | 0.63% |
| PEG ⓘ | N/A | |
Growth (Business expansion) | ||
| Revenue Growth ⓘ | -76.30% | 7.50% |
| RPS Growth (5Y CAGR) ⓘ | 62.04% | 8.70% |
| EPS Growth (5Y CAGR) ⓘ | N/A | -18.20% |
| BVPS Growth (5Y CAGR) ⓘ | 0.11% | 3.95% |
| Margin Growth (5Y Trend) ⓘ | N/A | -0.58% |
| FCF Growth (5Y CAGR) ⓘ | N/A | 0.88% |
| DPS Growth (5Y CAGR) ⓘ | N/A | 6.80% |
Quality (Business durability) | ||
| ROIC (Latest) ⓘ | -16.70% | 3.29% |
| ROA (Latest) ⓘ | -12.36% | 3.02% |
| ROIC (5Y Median) ⓘ | -13.69% | 4.75% |
| ROA (5Y Median) ⓘ | -9.67% | 1.93% |
| Net Debt / EBIT (Latest) ⓘ | N/A | 1.33 |
| Net Debt / EBIT (5Y Median) ⓘ | N/A | 1.83 |
| Net Debt / EBITDA (Latest) ⓘ | N/A | 0.99 |
| Net Debt / Assets ⓘ | 1.19% | 5.33% |
| EBITDA / Interest ⓘ | N/A | 9.63 |
| Operating Margin (Latest) ⓘ | -304.58% | 9.25% |
| Operating Margin (5Y Median) ⓘ | -236.39% | 7.80% |
| Debt to Equity (Latest) ⓘ | 15.14% | 28.99% |
| Profit Margin (Latest) ⓘ | -248.84% | 3.60% |
| Free Cash Flow (Latest) ⓘ | -$179.46M | |
Momentum (Price trend) | ||
| 3Y Return ⓘ | +211.88% | +37.48% |
| 12M Return (excl. last month) ⓘ | +169.86% | +20.85% |
| 6M Return ⓘ | +296.30% | +9.73% |
| Price vs. 200-Day MA ⓘ | +134.54% | +4.69% |
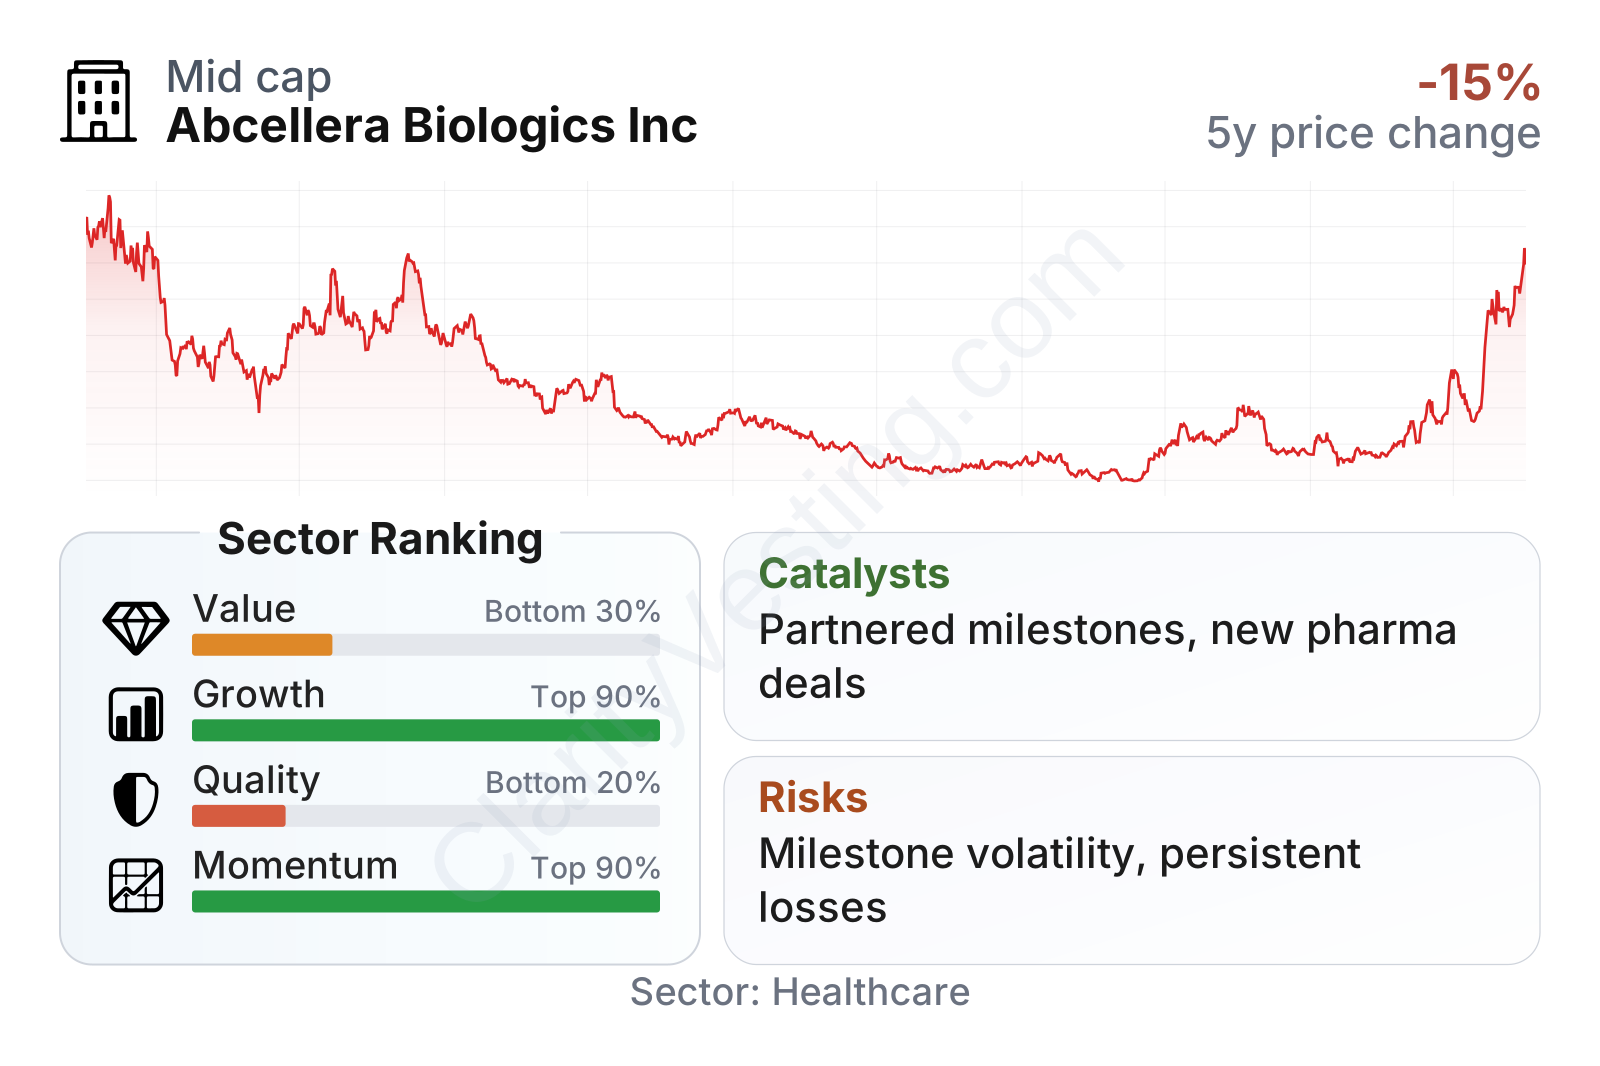
Abcellera sits in an unusual position. Its growth and share-price momentum rank very high versus much of the healthcare sector, but value and quality metrics rank weakly because the company is not consistently profitable and free cash flow remains negative. The balance sheet is a relative strength: debt is low for the sector, which matters for a company still investing heavily and absorbing volatile revenue.
The stock’s path has been highly volatile since 2021, with a long decline followed by a powerful rebound. That pattern usually signals that the market is reassessing the probability of future platform success rather than reacting to stable earnings power.
Growth
Abcellera operates in an attractive part of healthcare. Antibody therapeutics remain one of the most important categories in modern drug development, and drugmakers continue to search for better, faster, and more data-driven ways to discover candidates. That gives the company exposure to a growing sector, especially as biologics, precision medicine, and AI-enabled drug discovery continue to attract investment.
Its strategy is logical for long-duration growth. Abcellera is building an integrated discovery platform rather than relying on a single asset. If the platform continues to attract partners and generate a broad set of clinical-stage programs, the economics can become more valuable over time because milestone and royalty opportunities accumulate across many shots on goal. The company has also invested in internal capabilities, including manufacturing-related infrastructure and end-to-end development support, which could make it more useful to partners and allow it to capture more value per program.
The revenue record, however, shows how uneven this path can be. Growth has not followed a straight line. There were extreme spikes and steep declines tied to milestone timing and partner activity, and the most recent year-over-year reading shows another sharp drop. For a platform company like Abcellera, that volatility does not automatically mean the underlying business is deteriorating, but it does mean top-line progress is hard to judge quarter by quarter.
Cash generation is also a key point. Free cash flow was strongly positive earlier in the company’s public life, then turned meaningfully negative and has stayed negative. That reflects both weaker revenue and continued investment in research, facilities, and platform expansion. The upside case depends on whether today’s spending leads to a larger portfolio of partnered assets and future high-margin payments.
A major catalyst is the continued advancement of partnered programs. Each clinical move, licensing event, or milestone-triggering achievement can materially change near-term revenue and improve confidence in the platform. Another important opportunity is Abcellera’s ability to sign new partnerships with large pharmaceutical companies, because those relationships validate the technology and expand future royalty optionality. Any evidence that its internal and co-developed programs are moving toward clinical proof points would also matter, since that can shift the market’s view from “tool provider” to “platform with embedded asset value.”
Recent company updates have continued to emphasize expansion of the partnered pipeline and progress across programs. For a company at this stage, that matters more than short-term profitability alone. The central growth question is not whether next quarter’s revenue is smooth; it is whether Abcellera can steadily increase the number and quality of programs that may produce milestone and royalty streams later.
Risks
This article is for informational purposes only and does not constitute financial advice. Some content is AI-generated. See Disclaimer


