Stock Analysis · AllianceBernstein Holding L.P (AB)
Overview
AllianceBernstein Holding L.P. is an asset manager. In simple terms, it manages money on behalf of other people and institutions, then earns fees for doing so. Its clients include large institutions such as pension plans, endowments, insurers, sovereign entities, and intermediaries, as well as individuals through wealth-management channels. The firm invests across equities, fixed income, multi-asset strategies, alternatives, and private markets, and it also provides research and related services through its sell-side business.
The company’s economics are tied mainly to assets under management, often called AUM. When client assets rise because of market gains or net inflows, management fees usually improve; when markets fall or clients withdraw money, revenue can come under pressure. That makes AllianceBernstein’s business less capital-intensive than a bank’s, but more sensitive to market levels and investor sentiment.
Based on recent company disclosures, the main sources of revenue are broadly the following:
- Investment advisory and services fees: approximately 85% to 90% of total revenue. This is the core business and includes fees from managing institutional mandates, retail and intermediary products, private wealth accounts, and alternative strategies.
- Bernstein Research Services and related trading services: approximately 10% to 15%. This includes equity research, brokerage-related services, and market-making activities tied to the firm’s Bernstein franchise.
- Performance-based fees and other revenue: usually a low-single share of total revenue, but it can vary materially from period to period depending on fund performance, realizations, and market conditions.
Within managed assets, fixed income, equities, multi-asset, and alternatives all matter, while private wealth and institutional channels remain central distribution engines. That mix gives the firm exposure to both traditional public markets and faster-growing areas such as private alternatives, though public-market fees still dominate the overall earnings profile.
The business model is straightforward: gather client assets, retain them, earn recurring fees, keep operating costs under control, and return a large portion of earnings to unitholders through distributions.
The recent earnings flow shows how dependent profitability is on market-driven revenue. Profit recovered strongly in 2024, then softened again in 2025, which fits the pattern of a fee-based business with meaningful operating leverage rather than a steadily compounding industrial company.
Key Figures
| Metric | Value | Sector ⓘ |
|---|---|---|
| Date | Oct 24, 2026 | |
| Context | ||
| Sector | Financial Services | |
| Industry | Asset Management | |
| Market Cap ⓘ | $3.19B | |
| Beta ⓘ | 0.77 | |
Value (Cheapness) | ||
| P/E Ratio ⓘ | 10.28 | 12.46 |
| P/B Ratio ⓘ | 2.64 | 1.25 |
| FCF Yield ⓘ | 9.83% | 9.82% |
| Dividend Yield ⓘ | 9.95% | 2.94% |
| EBIT / EV ⓘ | N/A | 8.11% |
| PEG ⓘ | 0.63 | |
Growth (Business expansion) | ||
| Revenue Growth ⓘ | -40.30% | 9.10% |
| RPS Growth (5Y CAGR) ⓘ | -5.80% | 12.31% |
| EPS Growth (5Y CAGR) ⓘ | -14.36% | -6.97% |
| BVPS Growth (5Y CAGR) ⓘ | -6.90% | 5.02% |
| Margin Growth (5Y Trend) ⓘ | N/A | -4.00% |
| FCF Growth (5Y CAGR) ⓘ | 4.71% | 4.71% |
| DPS Growth (5Y CAGR) ⓘ | -0.73% | 8.92% |
Quality (Business durability) | ||
| ROIC (Latest) ⓘ | N/A | 9.18% |
| ROE (Latest) ⓘ | 25.82% | 13.93% |
| ROA (Latest) ⓘ | 25.77% | 1.57% |
| ROIC (5Y Median) ⓘ | N/A | 7.80% |
| ROE (5Y Median) ⓘ | 18.34% | 12.15% |
| ROA (5Y Median) ⓘ | 18.31% | 1.28% |
| Net Debt / EBIT (Latest) ⓘ | N/A | 1.02 |
| Net Debt / EBIT (5Y Median) ⓘ | N/A | 0.72 |
| Net Debt / EBITDA (Latest) ⓘ | N/A | 0.88 |
| Operating Margin (Latest) ⓘ | N/A | 22.30% |
| Operating Margin (5Y Median) ⓘ | 100.00% | 24.50% |
| Debt to Equity (Latest) ⓘ | N/A | 59.34% |
| Profit Margin (Latest) ⓘ | 390.65% | 26.42% |
| Free Cash Flow (Latest) ⓘ | $313.89M | |
Momentum (Price trend) | ||
| 3Y Return ⓘ | +58.60% | +95.73% |
| 12M Return (excl. last month) ⓘ | +1.84% | +17.30% |
| 6M Return ⓘ | -6.07% | +6.07% |
| Price vs. 200-Day MA ⓘ | -3.83% | +5.36% |
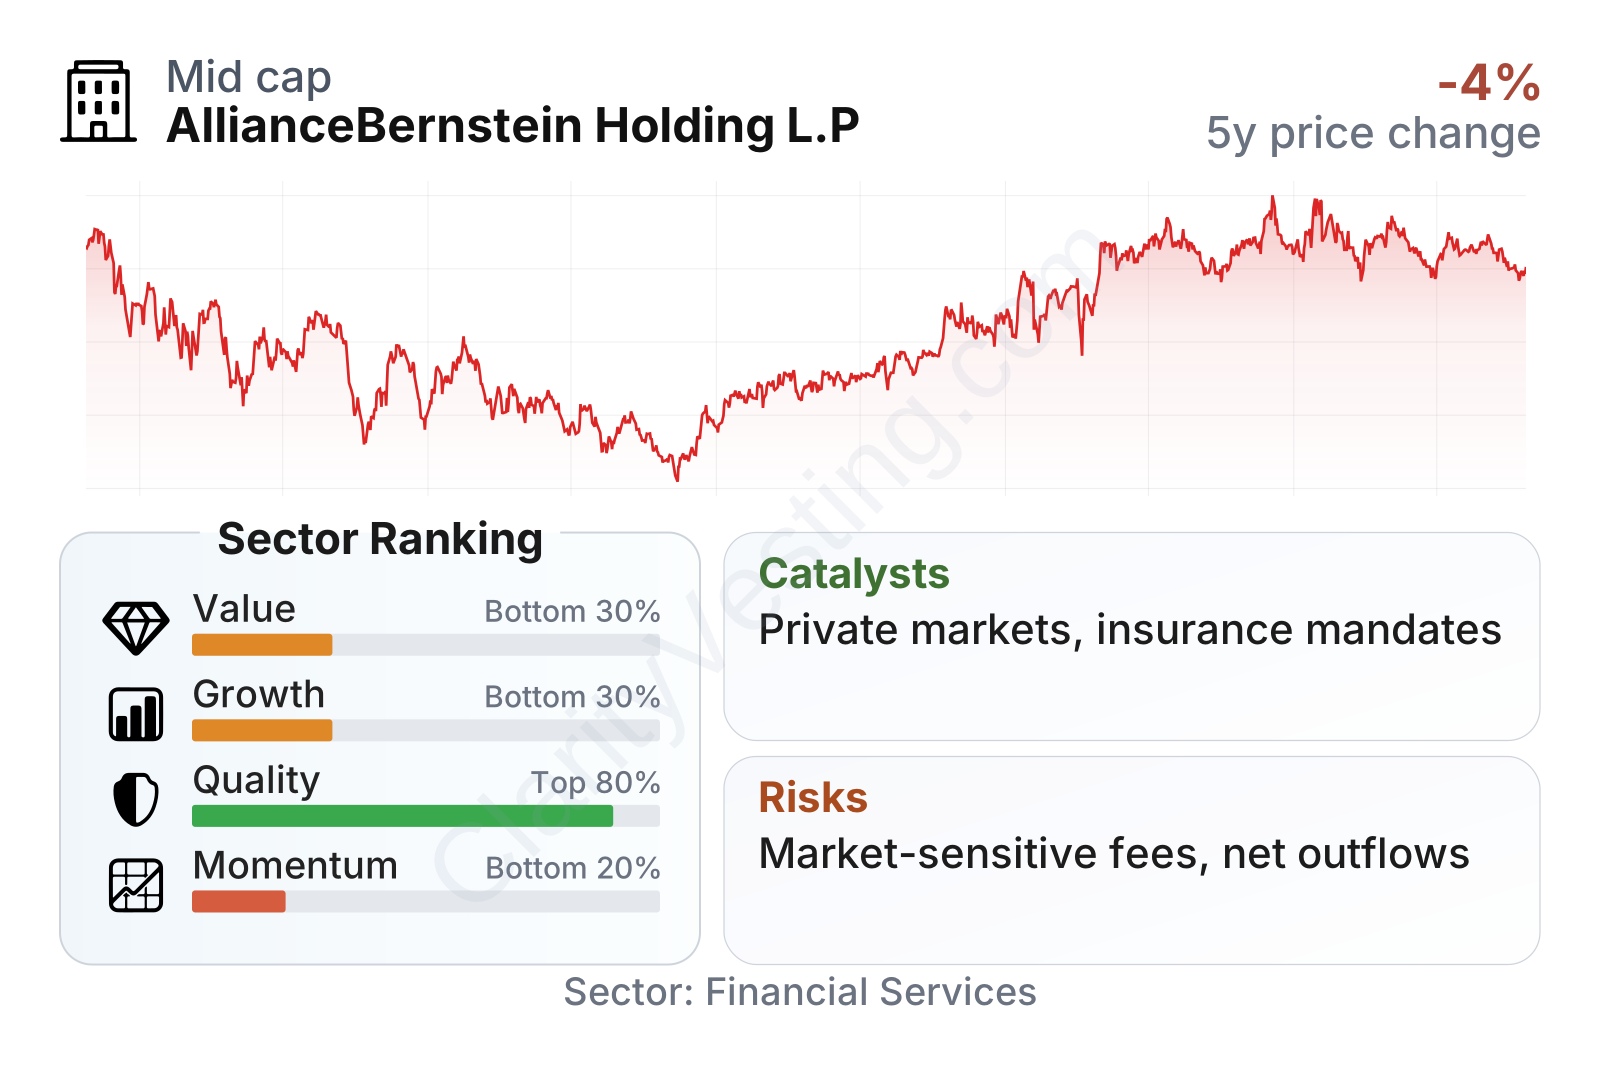
AllianceBernstein sits in an unusual position: quality measures are strong relative to the broader financial sector, but growth and market momentum rank much lower. The shares also stand out for an unusually high trailing distribution yield, while traditional value signals are mixed because the earnings multiple looks modest but the price-to-book ratio is clearly above the sector median.
The stock has moved through a full cycle over the last several years: a decline into 2023, a recovery through 2024 and 2025, and then a flatter pattern in 2026. That behavior is consistent with a market-sensitive asset manager whose earnings and valuation tend to move with investor confidence, asset prices, and flows.
In size terms, AllianceBernstein is a mid-sized listed asset manager rather than one of the global giants. Its beta below 1 suggests the stock has historically been somewhat less volatile than the broader equity market, although the operating business remains very sensitive to financial-market conditions.
Growth
Asset management is a long-term growth industry, but it is not an easy one. Global wealth continues to expand over time, retirement systems increasingly rely on market-based savings, and institutions continue to outsource investment management. At the same time, fee pressure in traditional products has intensified, especially in plain-vanilla equities and fixed income, while passive investing has kept taking share from many active managers.
For AllianceBernstein, the growth question is less about whether the industry exists and more about whether the firm can shift toward higher-value segments fast enough. Its strategy does have a rational growth angle: deepen private markets and alternatives, expand insurance-related asset management, grow wealth-management distribution, and use its research and institutional relationships to support cross-selling. Those areas typically carry stickier client relationships and can support better margins than commoditized public-market products.
Management has also emphasized private alternatives and insurance solutions as strategic priorities in recent public communications. Those businesses matter because they can diversify revenue away from daily market swings and widen the client base beyond traditional mutual-fund and institutional mandates.
Earnings per unit show a recovery from the 2023 trough into 2024 and 2025, which indicates that the firm can rebuild profitability when markets and fee levels improve. Even so, the longer-term record is not a clean upward climb, so growth has been cyclical rather than consistently compounding.
Book value per share has moved unevenly and declined over the most recent multi-year period shown. For an asset manager, that does not carry the same meaning as it would for a bank, but it still suggests that capital growth has not been the main attraction. The case for future expansion depends more on fee growth, product mix, and flows than on balance-sheet accumulation.
A meaningful recent opportunity is the broader institutional demand for private credit, private markets, and outsourced investment solutions. AllianceBernstein is not the largest player in those categories, but it already has a recognized institutional platform, which gives it a credible path to participate if fundraising remains healthy. Another favorable factor is the ongoing need from insurers and retirement-related clients for fixed-income and customized mandates, areas where the firm has long-standing capabilities.
Risks
This article is for informational purposes only and does not constitute financial advice. Some content is AI-generated. See Disclaimer


