Stock Analysis · Allied Gold Corporation (AAUC)
Overview
Allied Gold Corporation is a gold producer focused on mining, processing, and selling gold. The company operates producing mines in Africa and is also advancing development projects intended to lift future output. In simple terms, it earns money by extracting ore, processing it into gold, and selling that gold at market prices. Because gold is a globally traded commodity, Allied Gold’s results depend heavily on how much it produces, what it costs to produce each ounce, and the price of gold.
Its operating base is centered on three main producing assets: Sadiola in Mali, Bonikro in Côte d’Ivoire, and Agbaou in Côte d’Ivoire. The company has also been developing growth projects, most notably Kurmuk in Ethiopia and expansion work around Sadiola. That mix matters for long-term analysis: current mines fund the business today, while development projects are meant to raise production and improve scale over time.
Revenue is overwhelmingly tied to gold sales. Based on the company’s reporting and asset mix, the revenue breakdown is best understood as follows:
- Gold sales from Sadiola, Bonikro, and Agbaou: approximately more than 95% of revenue. This includes ounces sold from the company’s producing mines and is the core of the business.
- By-product and other mining-related revenue: approximately less than 5% of revenue when present. This can include minor ancillary items, but it is not a major driver of the business.
Geographically, this is an Africa-focused producer rather than a globally diversified mining major. That gives it concentrated exposure to a handful of mines, which can be powerful when operations go well, but it also means site-specific and country-specific developments have an outsized effect on results.
The financial flow over the last few years shows a business that has become much larger at the revenue and operating-profit level. Revenue rose from roughly $670 million in 2022 to about $1.33 billion in 2025, while gross profit expanded sharply as well. The most important point is that operating performance improved materially in 2025 after weak reported earnings in 2023 and 2024.
The broad trend is encouraging at the operating level: sales and gross profit have expanded significantly, and interest expense has stayed relatively contained. However, reported net income has remained under pressure, which shows that stronger mine-level economics have not yet translated into consistently clean bottom-line profitability.
Key Figures
| Metric | Value | Sector ⓘ |
|---|---|---|
| Date | Oct 24, 2026 | |
| Context | ||
| Sector | Basic Materials | |
| Industry | Gold | |
| Market Cap ⓘ | $2.88B | |
| Beta ⓘ | 0.83 | |
Value (Cheapness) | ||
| P/E Ratio ⓘ | N/A | 16.92 |
| P/B Ratio ⓘ | 7.42 | 1.66 |
| FCF Yield ⓘ | -0.79% | 5.83% |
| Dividend Yield ⓘ | N/A | 2.07% |
| EBIT / EV ⓘ | 11.50% | 6.38% |
| PEG ⓘ | N/A | |
Growth (Business expansion) | ||
| Revenue Growth ⓘ | 45.40% | 11.25% |
| RPS Growth (5Y CAGR) ⓘ | 13.00% | 4.49% |
| EPS Growth (5Y CAGR) ⓘ | -80.50% | -15.24% |
| BVPS Growth (5Y CAGR) ⓘ | 86.84% | 5.49% |
| Margin Growth (5Y Trend) ⓘ | 9.00% | -1.54% |
| FCF Growth (5Y CAGR) ⓘ | N/A | 0.37% |
| DPS Growth (5Y CAGR) ⓘ | N/A | 5.91% |
Quality (Business durability) | ||
| ROIC (Latest) ⓘ | N/A | 9.59% |
| ROA (Latest) ⓘ | -3.18% | 4.92% |
| ROIC (5Y Median) ⓘ | N/A | 7.91% |
| ROA (5Y Median) ⓘ | -10.16% | 3.92% |
| Net Debt / EBIT (Latest) ⓘ | 0.01 | 1.36 |
| Net Debt / EBIT (5Y Median) ⓘ | N/A | 1.69 |
| Net Debt / EBITDA (Latest) ⓘ | 0.01 | 0.93 |
| Net Debt / Assets ⓘ | 0.15% | 13.69% |
| EBITDA / Interest ⓘ | 36.09 | 12.38 |
| Operating Margin (Latest) ⓘ | 24.20% | 13.24% |
| Operating Margin (5Y Median) ⓘ | 4.21% | 11.82% |
| Debt to Equity (Latest) ⓘ | 38.85% | 40.30% |
| Profit Margin (Latest) ⓘ | -4.19% | 6.38% |
| Free Cash Flow (Latest) ⓘ | -$22.70M | |
Momentum (Price trend) | ||
| 3Y Return ⓘ | N/A | +73.47% |
| 12M Return (excl. last month) ⓘ | +41.65% | +27.59% |
| 6M Return ⓘ | -35.31% | -4.02% |
| Price vs. 200-Day MA ⓘ | -21.59% | -0.65% |
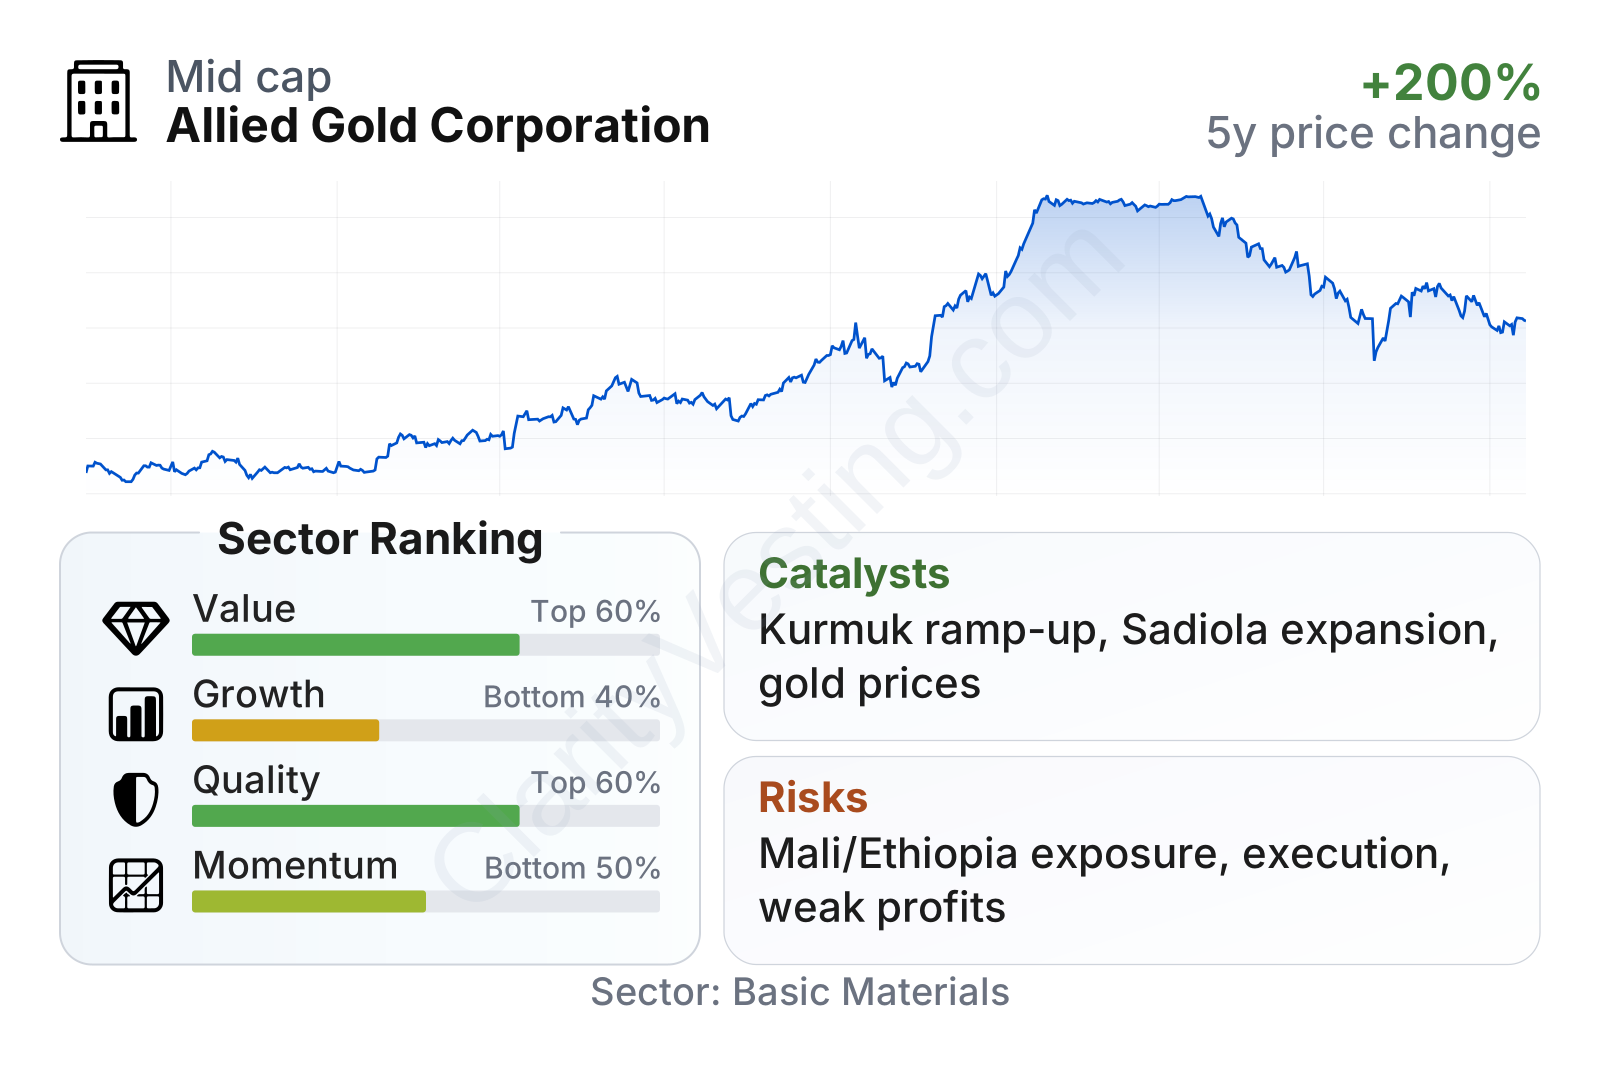
Allied Gold is now a mid-sized gold company by market value, with a share price that rose strongly over the last year before pulling back in recent months. That pattern usually points to a market that has become more optimistic about the company’s growth pipeline, while still reassessing execution risk.
The factor picture is mixed. On value, the stock does not look obviously stretched on enterprise-value-based earnings metrics, and its EBIT to enterprise value is above the sector median. At the same time, price to book is much higher than the sector median, which suggests the market is assigning meaningful value to future production growth rather than just current assets. On quality, leverage is low relative to many peers and interest coverage is strong, but profitability still looks weaker than the sector because net income remains negative. On growth, revenue expansion has been strong, yet earnings growth has lagged badly, which shows that scale has arrived faster than steady bottom-line returns.
Growth
Gold mining is part of a sector with long-term relevance rather than high structural growth in the usual technology sense. Demand for gold is supported by jewelry, investment demand, central bank purchases, and its role as a perceived store of value during inflationary or geopolitical stress. That means the sector’s appeal often improves when macroeconomic uncertainty rises or when gold prices stay elevated.
For Allied Gold specifically, the growth case is more company-driven than sector-driven. The central question is whether it can transform itself from a smaller African producer into a larger multi-asset company with higher annual output and better unit economics. Its strategy broadly makes sense: increase scale through mine development, extend mine life at existing operations, and spread fixed costs across a larger production base.
Recent revenue growth has been strong, with year-over-year increases well above the sector median in several periods. That confirms the company is already moving through an expansion phase rather than just talking about one. Five-year revenue per share growth also compares favorably with the sector, which supports the idea that the asset base is becoming more productive.
Cash generation has been less linear. Free cash flow was negative in earlier periods, then turned clearly positive more recently. For a mining company in build-out mode, that swing is important: it may indicate that some heavy spending has started to convert into operating cash rather than only consuming it. If that shift becomes durable, it would strengthen the company’s financial flexibility.
The main catalyst is Kurmuk in Ethiopia, which management has presented as a major growth project capable of lifting production and changing the company’s overall scale. Another important catalyst is continued optimization at Sadiola, where expansion and improved performance can materially affect consolidated output. In a rising gold-price environment, these operating gains can have amplified effects because additional ounces are sold into a strong commodity market.
Recent company communications have also emphasized construction progress, project financing, and production ramp-up plans. For a long-term view, these updates matter more than short-term quarterly swings because they help answer whether Allied Gold is becoming a meaningfully larger producer over the next several years.
Risks
This article is for informational purposes only and does not constitute financial advice. Some content is AI-generated. See Disclaimer


