Stock Analysis · American Airlines Group (AAL)
Overview
American Airlines Group is one of the largest airline companies in the world. Through American Airlines, regional partners, and cargo operations, it transports passengers across the United States and internationally. Its network is built around major hubs such as Dallas-Fort Worth, Charlotte, Miami, Chicago, Phoenix, Philadelphia, Washington, and New York, giving it broad domestic coverage and a strong position on routes to Latin America, Europe, and parts of Asia.
The business is still overwhelmingly driven by passenger flying. Based on recent annual reporting structure and company disclosures, revenue is mainly generated from the following sources:
- Passenger revenue: about 85% to 90% — ticket sales from domestic and international travel, including premium cabins, Main Cabin fares, and partner-related traffic.
- Loyalty and other revenue: about 8% to 12% — primarily the AAdvantage program, including miles sold to credit card partners and other commercial partners, plus ancillary items such as baggage fees, seat selection, onboard services, and some third-party services.
- Cargo revenue: about 1% to 3% — freight transported in the belly space of passenger aircraft and through related cargo services.
American’s scale is important because airlines need extensive fleets, airport access, labor, and scheduling systems to operate efficiently. The trade-off is that this is a capital-intensive business where profits can change quickly when fuel, labor, or demand moves in the wrong direction.
The long-term revenue picture shows a strong rebound from the pandemic period to more than $54 billion annually, but the earnings flow has been much less stable. Revenue has recovered and then inched higher, while operating income and net income have remained more volatile, showing that cost control matters as much as passenger demand for this company.
The business has clearly rebuilt sales since 2021, but the later periods also show pressure from operating costs and financing costs. In other words, American has regained scale faster than it has rebuilt durable profitability.
Key Figures
| Metric | Value | Sector ⓘ |
|---|---|---|
| Date | Oct 03, 2026 | |
| Context | ||
| Sector | Industrials | |
| Industry | Airlines | |
| Market Cap ⓘ | $9.01B | |
| Beta ⓘ | 1.33 | |
Value (Cheapness) | ||
| P/E Ratio ⓘ | N/A | 22.45 |
| P/B Ratio ⓘ | N/A | 1.98 |
| FCF Yield ⓘ | 3.16% | 6.31% |
| Dividend Yield ⓘ | N/A | 1.96% |
| EBIT / EV ⓘ | 3.74% | 4.81% |
| PEG ⓘ | 0.09 | |
Growth (Business expansion) | ||
| Revenue Growth ⓘ | 16.30% | 9.10% |
| RPS Growth (5Y CAGR) ⓘ | 15.49% | 7.75% |
| EPS Growth (5Y CAGR) ⓘ | N/A | -13.59% |
| BVPS Growth (5Y CAGR) ⓘ | -16.16% | 6.22% |
| Margin Growth (5Y Trend) ⓘ | 5.99% | 0.72% |
| FCF Growth (5Y CAGR) ⓘ | N/A | 10.98% |
| DPS Growth (5Y CAGR) ⓘ | 91.90% | 9.48% |
Quality (Business durability) | ||
| ROIC (Latest) ⓘ | 3.89% | 10.92% |
| ROA (Latest) ⓘ | -0.52% | 5.41% |
| ROIC (5Y Median) ⓘ | 4.84% | 9.21% |
| ROA (5Y Median) ⓘ | 0.19% | 4.94% |
| Net Debt / EBIT (Latest) ⓘ | 25.20 | 2.07 |
| Net Debt / EBIT (5Y Median) ⓘ | 15.13 | 2.28 |
| Net Debt / EBITDA (Latest) ⓘ | 10.32 | 1.43 |
| Net Debt / Assets ⓘ | 54.02% | 19.27% |
| EBITDA / Interest ⓘ | 2.02 | 9.53 |
| Operating Margin (Latest) ⓘ | 2.36% | 10.50% |
| Operating Margin (5Y Median) ⓘ | 4.39% | 10.27% |
| Debt to Equity (Latest) ⓘ | -899.52% | 65.48% |
| Profit Margin (Latest) ⓘ | -0.56% | 6.62% |
| Free Cash Flow (Latest) ⓘ | $285.00M | |
Momentum (Price trend) | ||
| 3Y Return ⓘ | +4.37% | +58.56% |
| 12M Return (excl. last month) ⓘ | +0.45% | +15.63% |
| 6M Return ⓘ | +24.49% | +4.19% |
| Price vs. 200-Day MA ⓘ | -3.59% | +0.93% |
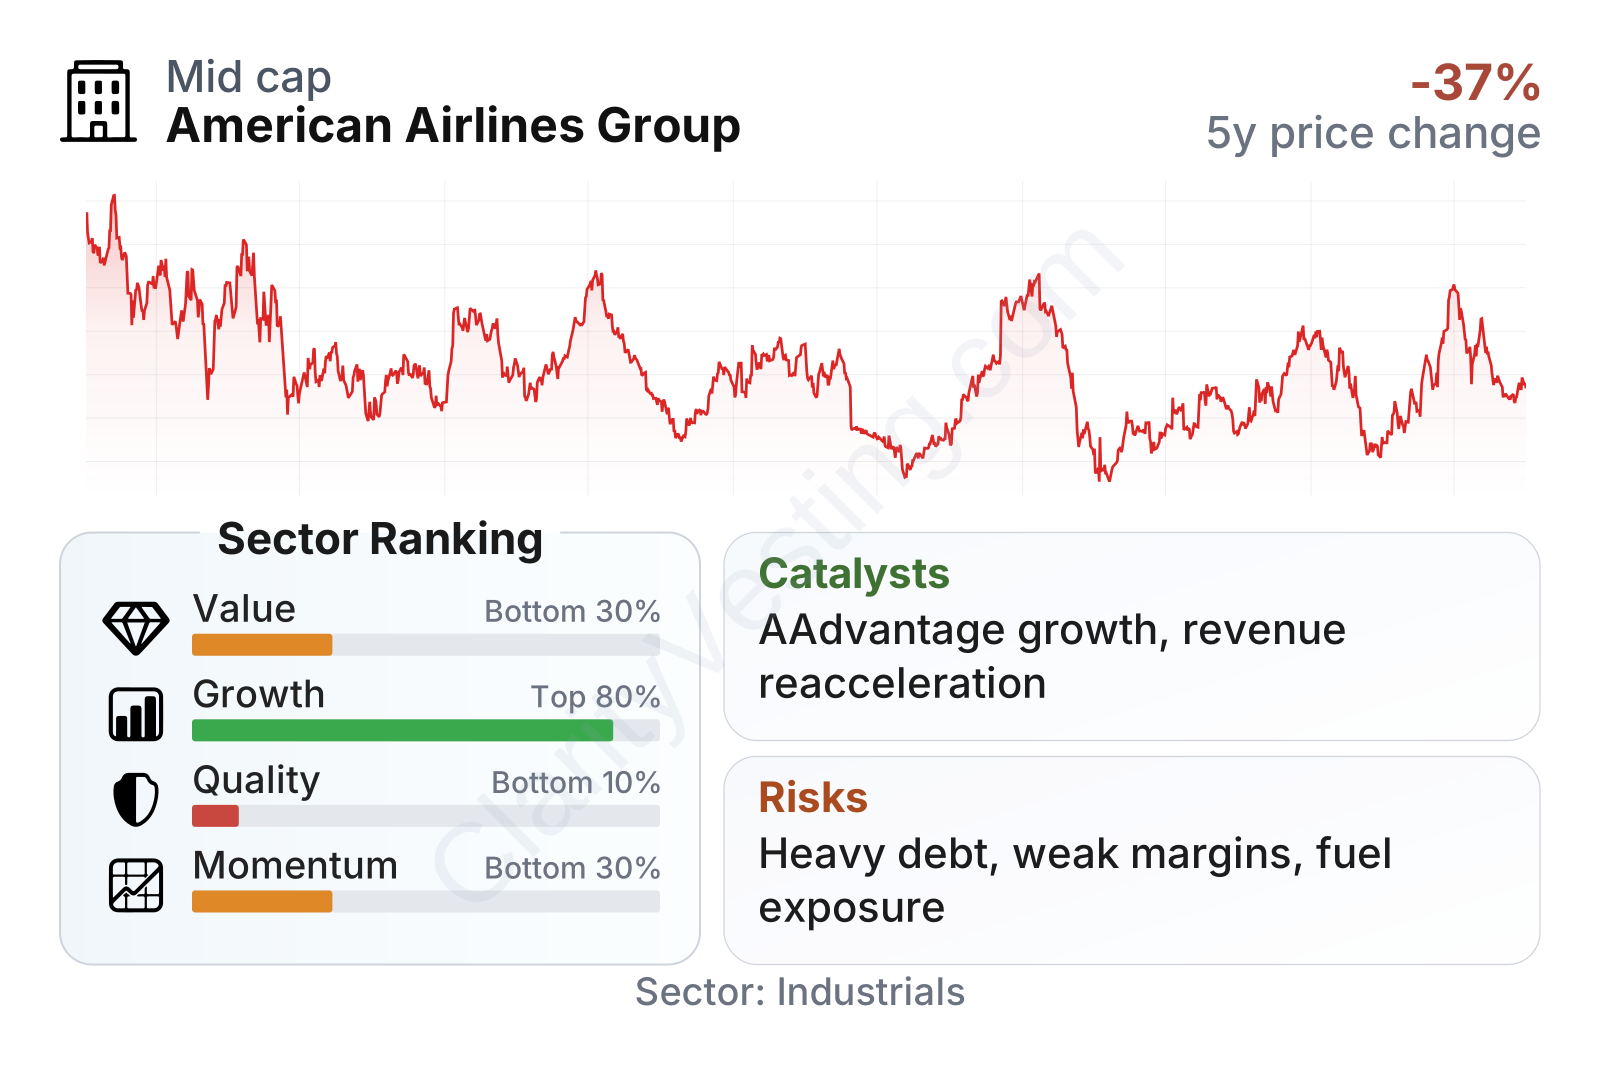
American is a large airline by revenue and network size, but the financial profile is mixed. Growth measures rank relatively well versus the broader industrial sector, helped by the travel recovery and improving revenue per share over several years. By contrast, quality measures rank near the bottom of the sector because returns on capital are low, leverage is very high, and interest coverage is thin. Value measures do not screen as especially attractive either, because low margins and a still-heavy debt load reduce the benefit of a modest market capitalization.
The stock has also been volatile. Over the last several years, it has moved through wide swings rather than a steady upward trend, which matches the airline industry’s sensitivity to economic cycles, fuel prices, and company-specific execution.
Growth
The airline sector is a mature industry, not a high-growth one in the way software or semiconductors can be. However, it can still expand through rising travel demand, premium seating, loyalty monetization, and network optimization. Over the long run, air travel tends to benefit from population growth, business mobility, tourism, and international connectivity. That gives the sector a structural demand base, even if growth comes in uneven cycles.
American’s current growth case is built less on opening an entirely new market and more on improving what it already has: filling more seats, raising unit revenue, steering customers into premium products, and getting more value from the AAdvantage loyalty ecosystem. Management has also emphasized commercial execution after earlier disruption tied to sales strategy changes, particularly around corporate and agency channels.
The recent revenue trend suggests a business that moved from post-pandemic rebound to a slower, more normal pace, then reaccelerated in the most recent periods. The latest year-over-year growth is running above the broader sector median, which is encouraging, but it should also be viewed in the context of airlines’ naturally uneven quarter-to-quarter performance.
Cash generation has improved materially from the stressed years, but it remains inconsistent. American has produced positive trailing free cash flow in recent periods, yet the path has not been smooth. That matters because cash flow is central for airlines: it funds aircraft investment, debt reduction, and resilience during weaker travel periods.
A practical catalyst for future growth is the company’s loyalty program and co-branded card relationships. These activities usually carry better economics than selling a basic airline seat and can deepen customer retention. Another catalyst is any sustained improvement in business travel mix and premium demand, since higher-yield seats can lift margins even if overall traffic growth is modest. Continued normalization in aircraft availability across the industry could also help capacity planning and operational reliability.
Recent company updates have also pointed to ongoing efforts to strengthen the network, improve revenue management, and recover share in indirect booking channels. For a company with American’s size, even modest gains in utilization and pricing discipline can have a meaningful financial impact.
Risks
This article is for informational purposes only and does not constitute financial advice. Some content is AI-generated. See Disclaimer


