Stock Analysis · AIA Group Ltd (AAGIY)
Overview
AIA Group is one of the largest life and health insurers focused on Asia-Pacific. The company sells long-term savings, protection, retirement, and medical coverage products, and it also earns fees from managing wealth-related products for policyholders and third parties. Its footprint stretches across major Asian markets including mainland China, Hong Kong, Thailand, Singapore, Malaysia, and several other high-growth economies. That regional focus matters because Asia remains one of the world’s most underinsured areas, with rising household wealth, aging populations, and expanding demand for retirement and health protection.
AIA’s business model is fairly simple at its core: it collects premiums, invests the float generated by those policies, pays claims and benefits over time, and aims to earn an attractive spread while growing new business. For a life insurer, reported revenue can be volatile because accounting includes investment-related movements, so operating indicators such as new business value, annualized new premiums, and embedded value are often more useful than revenue alone when judging the franchise.
Based on company disclosures, the main economic sources of earnings and business activity are broadly concentrated in the following areas:
- Life insurance and long-term savings products: approximately 60% to 70% of new business value in recent years. This includes participating products, unit-linked policies, whole life, and other savings-oriented contracts.
- Health and accident insurance: approximately 20% to 30% of new business value. This includes medical reimbursement, critical illness, hospitalization, and protection-focused policies.
- Retirement, pensions, and group insurance: a smaller but meaningful share, often around 5% to 10% depending on market conditions and product mix.
- Investment and fee-based income: a low-to-mid single-digit share of total business activity, tied to asset management and investment-linked services, though reported accounting revenue can vary much more because of market effects.
AIA is also diversified by geography rather than by a single domestic market. Historically, Hong Kong and mainland China have been especially important profit engines, while Thailand, Singapore, Malaysia, and other ASEAN operations add scale and balance. That mix gives AIA exposure to both wealthy financial hubs and faster-penetrating emerging insurance markets.
The profit flow over the last several years shows why AIA is best understood through normalized earnings power rather than one-year accounting swings. Revenue and gross profit have moved around sharply at times, but operating income and net income recovered strongly after the weaker 2022 period. That pattern is common in insurers with large investment books and reinforces the value of focusing on underlying franchise strength, distribution reach, and product mix.
Key Figures
| Metric | Value | Sector ⓘ |
|---|---|---|
| Date | Oct 17, 2026 | |
| Context | ||
| Sector | Financial Services | |
| Industry | Insurance - Life | |
| Market Cap ⓘ | $94.38B | |
| Beta ⓘ | 0.65 | |
Value (Cheapness) | ||
| P/E Ratio ⓘ | 12.21 | 12.26 |
| P/B Ratio ⓘ | 2.41 | 1.23 |
| FCF Yield ⓘ | 6.74% | 10.40% |
| Dividend Yield ⓘ | 2.71% | 3.02% |
| EBIT / EV ⓘ | N/A | 8.14% |
| PEG ⓘ | 0.36 | |
Growth (Business expansion) | ||
| Revenue Growth ⓘ | -2.50% | 9.35% |
| RPS Growth (5Y CAGR) ⓘ | -5.34% | 12.19% |
| EPS Growth (5Y CAGR) ⓘ | 83.99% | -9.53% |
| BVPS Growth (5Y CAGR) ⓘ | -5.09% | 4.99% |
| Margin Growth (5Y Trend) ⓘ | 5.97% | -3.86% |
| FCF Growth (5Y CAGR) ⓘ | 11.94% | 4.81% |
| DPS Growth (5Y CAGR) ⓘ | 6.45% | 8.79% |
Quality (Business durability) | ||
| ROIC (Latest) ⓘ | N/A | 9.49% |
| ROE (Latest) ⓘ | 34.89% | 13.90% |
| ROA (Latest) ⓘ | 4.22% | 1.55% |
| ROIC (5Y Median) ⓘ | 10.99% | 7.86% |
| ROE (5Y Median) ⓘ | 12.01% | 12.17% |
| ROA (5Y Median) ⓘ | 1.92% | 1.30% |
| Net Debt / EBIT (Latest) ⓘ | N/A | 0.96 |
| Net Debt / EBIT (5Y Median) ⓘ | 1.21 | 0.73 |
| Net Debt / EBITDA (Latest) ⓘ | 0.75 | 0.92 |
| Operating Margin (Latest) ⓘ | N/A | 22.30% |
| Operating Margin (5Y Median) ⓘ | 25.01% | 24.63% |
| Debt to Equity (Latest) ⓘ | 52.01% | 58.56% |
| Profit Margin (Latest) ⓘ | 30.88% | 26.57% |
| Free Cash Flow (Latest) ⓘ | $6.36B | |
Momentum (Price trend) | ||
| 3Y Return ⓘ | +15.40% | +88.33% |
| 12M Return (excl. last month) ⓘ | +3.55% | +19.38% |
| 6M Return ⓘ | -10.93% | +4.75% |
| Price vs. 200-Day MA ⓘ | -7.54% | +3.50% |
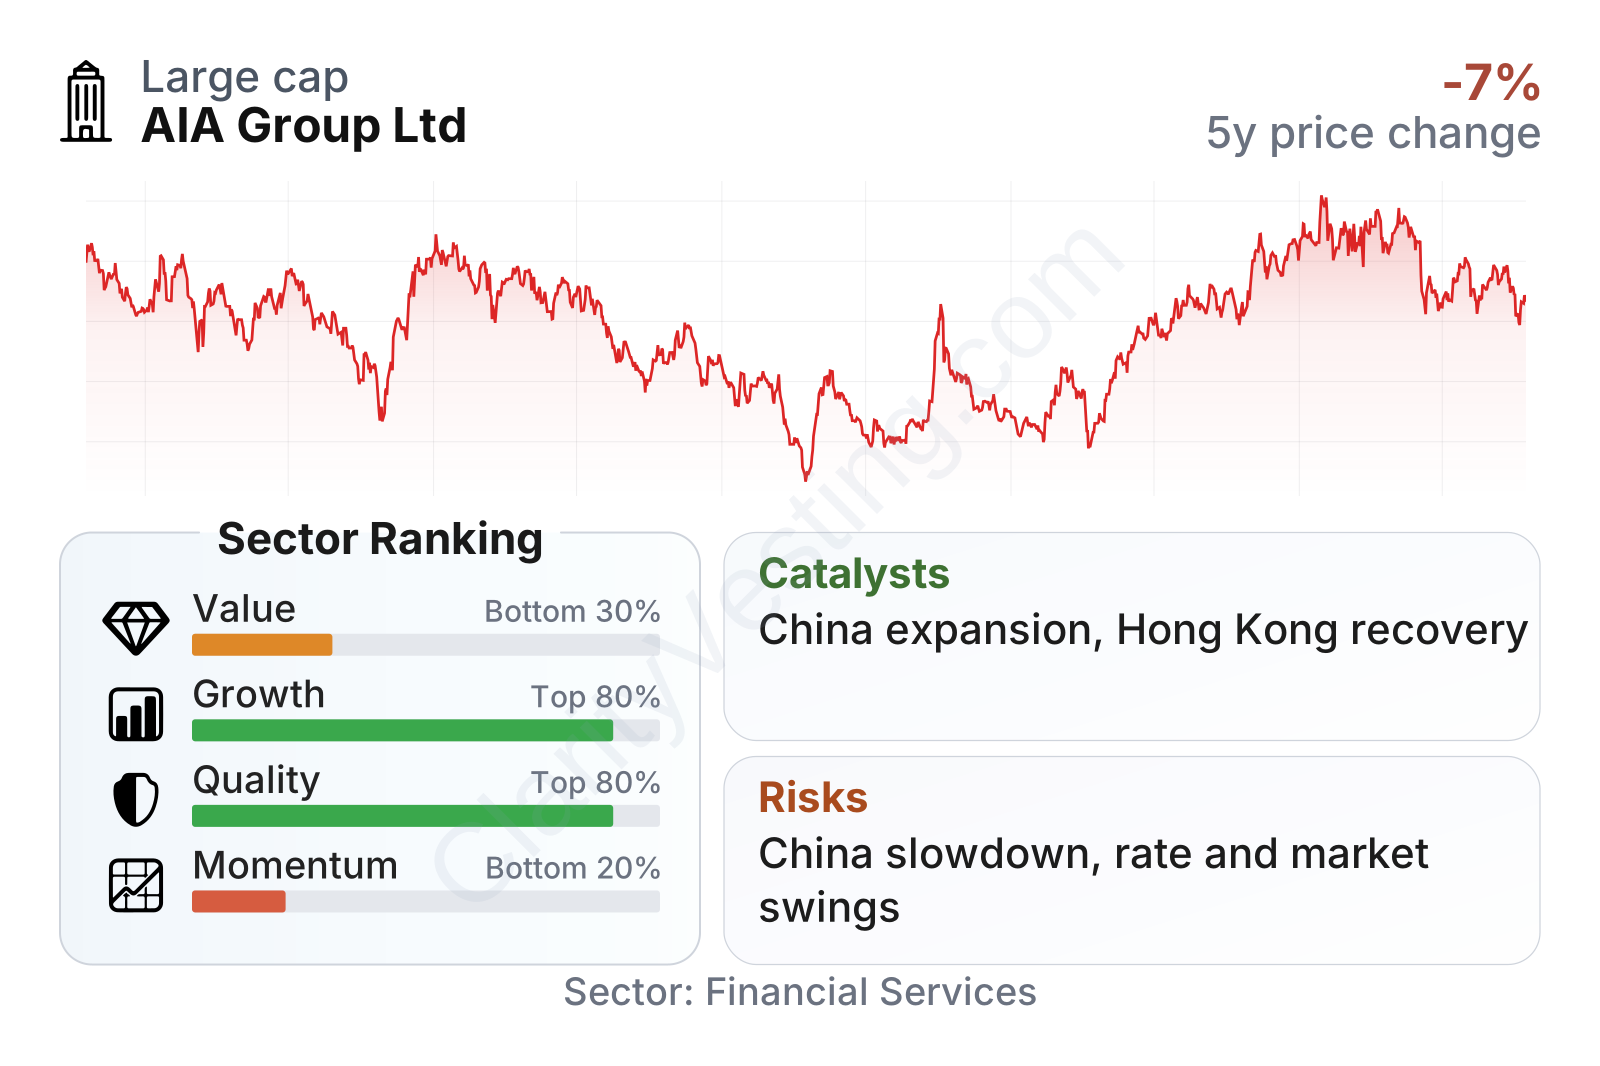
AIA is a very large insurer with a market value close to $100 billion and relatively low share-price volatility, reflected in a beta below 0.7. The factor mix is unusual in a good way: quality and growth rank well versus the sector, while momentum is weak and value is only middling. In practice, that means the market is not treating AIA like a cheap deep-value stock, but the business still shows strong profitability, solid cash generation, and better long-term earnings compounding than many peers. The weak momentum profile suggests the share price has lagged much of the sector recently even as the company’s underlying operating quality remains strong.
Growth
AIA operates in a part of financial services that still has a long runway. Across Asia, insurance penetration and retirement preparedness remain below levels seen in many developed Western markets. Rising incomes, longer life expectancy, growing medical costs, and limited public pension coverage all support long-term demand for protection and savings products. That puts AIA in a structurally favorable sector, even if year-to-year reported revenue can be noisy.
The company’s strategy is coherent for this environment. It emphasizes agency distribution, bancassurance partnerships, digital tools, and a broad product menu spanning protection, health, wealth, and retirement. AIA has invested heavily in building a proprietary agent force, which is a major asset in life insurance because advice-led selling remains important for complex long-duration products. In higher-value markets such as Hong Kong and Singapore, this supports richer product mix; in developing markets, it helps AIA capture first-time insurance buyers as household incomes rise.
A major catalyst remains the reopening and normalization of cross-border activity between mainland China and Hong Kong, which has already helped demand in Hong Kong visitor business. Another important growth lever is the expansion of AIA’s presence in mainland China through new licenses and broader geographic reach. The company has also continued to push health and wellness ecosystems, which can deepen customer engagement and improve retention over time.
Even with some softness in recent revenue comparisons, the longer-term earnings pattern remains constructive. Five-year earnings per share growth has been far stronger than the sector median, and free cash flow has also compounded at a healthy pace. Margin trends have improved over that same period, suggesting the business is not relying only on top-line expansion but is also converting more of its scale into profit.
The earnings path has been uneven from year to year, which is common in insurance because of investment-market effects and assumption changes, but the broader direction after the 2022 dip has been one of recovery. That matters more for a long-term reader than any single annual print.
Book value per share has not been as strong as earnings growth, and that is one of the more mixed points in the profile. Still, the recent rebound suggests balance-sheet value is stabilizing after earlier pressure from market and accounting effects. For insurers, that recovery can be important because it supports capital flexibility, dividends, and the ability to keep writing profitable new business.
Risks
This article is for informational purposes only and does not constitute financial advice. Some content is AI-generated. See Disclaimer


