Stock Analysis · Applied Aerospace & Defense Inc (AADX)
Overview
Applied Aerospace & Defense Inc. operates in the aerospace and defense supply chain. The company designs and manufactures specialty products used in aircraft, space, and defense programs, with an emphasis on engineered composite structures, shelters, and other mission-critical components. In simple terms, it sells highly specialized hardware that must meet demanding performance and reliability standards for military and aerospace customers.
The business appears to be driven primarily by defense-oriented and aerospace-related manufacturing programs. Based on the company’s public filings and business descriptions, revenue is mainly tied to products and services such as:
- Engineered aerospace and defense structures: composite assemblies, structural parts, and related components used in aircraft and defense platforms.
- Shelter and mobility systems: deployable shelters, containers, and support systems used for military and operational environments.
- Other specialized manufacturing and support work: program-related production, integration, and related services for government and industrial customers.
Public disclosures do not provide a simple, consistently updated revenue mix by product line in the materials reviewed, so a precise percentage split would risk overstating what is known. What is clear is that the company is closely tied to defense and aerospace procurement cycles, where a limited number of large programs can materially shape annual revenue.
One notable operating pattern is that sales increased sharply from about $400 million in 2024 to roughly $604 million in 2025, while gross profit also improved. However, the step-up in revenue did not translate into bottom-line profitability because interest expense rose very heavily, leaving net income negative despite positive operating income.
The flow from revenue to profit shows a business that has recently expanded sales and gross profit, but where financing costs have absorbed much of the operating progress. That distinction matters: the core operations improved, yet the capital structure remains a major constraint on shareholder returns.
Key Figures
| Metric | Value | Sector ⓘ |
|---|---|---|
| Date | Oct 03, 2026 | |
| Context | ||
| Sector | Industrials | |
| Industry | Aerospace & Defense | |
| Market Cap ⓘ | $2.07B | |
| Beta ⓘ | N/A | |
Value (Cheapness) | ||
| P/E Ratio ⓘ | N/A | 22.45 |
| P/B Ratio ⓘ | 2.15 | 1.98 |
| FCF Yield ⓘ | -6.01% | 6.31% |
| Dividend Yield ⓘ | N/A | 1.96% |
| EBIT / EV ⓘ | -4.62% | 4.81% |
| PEG ⓘ | N/A | |
Growth (Business expansion) | ||
| Revenue Growth ⓘ | 47.40% | 9.10% |
| RPS Growth (5Y CAGR) ⓘ | N/A | 7.75% |
| EPS Growth (5Y CAGR) ⓘ | N/A | -13.59% |
| BVPS Growth (5Y CAGR) ⓘ | N/A | 6.22% |
| Margin Growth (5Y Trend) ⓘ | N/A | 0.72% |
| FCF Growth (5Y CAGR) ⓘ | N/A | 10.98% |
| DPS Growth (5Y CAGR) ⓘ | N/A | 9.48% |
Quality (Business durability) | ||
| ROIC (Latest) ⓘ | N/A | 10.92% |
| ROA (Latest) ⓘ | N/A | 5.41% |
| ROIC (5Y Median) ⓘ | N/A | 9.21% |
| ROA (5Y Median) ⓘ | N/A | 4.94% |
| Net Debt / EBIT (Latest) ⓘ | N/A | 2.07 |
| Net Debt / EBIT (5Y Median) ⓘ | N/A | 2.28 |
| Net Debt / EBITDA (Latest) ⓘ | N/A | 1.43 |
| Net Debt / Assets ⓘ | 27.56% | 19.27% |
| EBITDA / Interest ⓘ | N/A | 9.53 |
| Operating Margin (Latest) ⓘ | -20.27% | 10.50% |
| Operating Margin (5Y Median) ⓘ | N/A | 10.27% |
| Debt to Equity (Latest) ⓘ | 52.13% | 65.48% |
| Profit Margin (Latest) ⓘ | -30.24% | 6.62% |
| Free Cash Flow (Latest) ⓘ | -$124.41M | |
Momentum (Price trend) | ||
| 3Y Return ⓘ | N/A | +58.56% |
| 12M Return (excl. last month) ⓘ | N/A | +15.63% |
| 6M Return ⓘ | N/A | +4.19% |
| Price vs. 200-Day MA ⓘ | N/A | +0.93% |
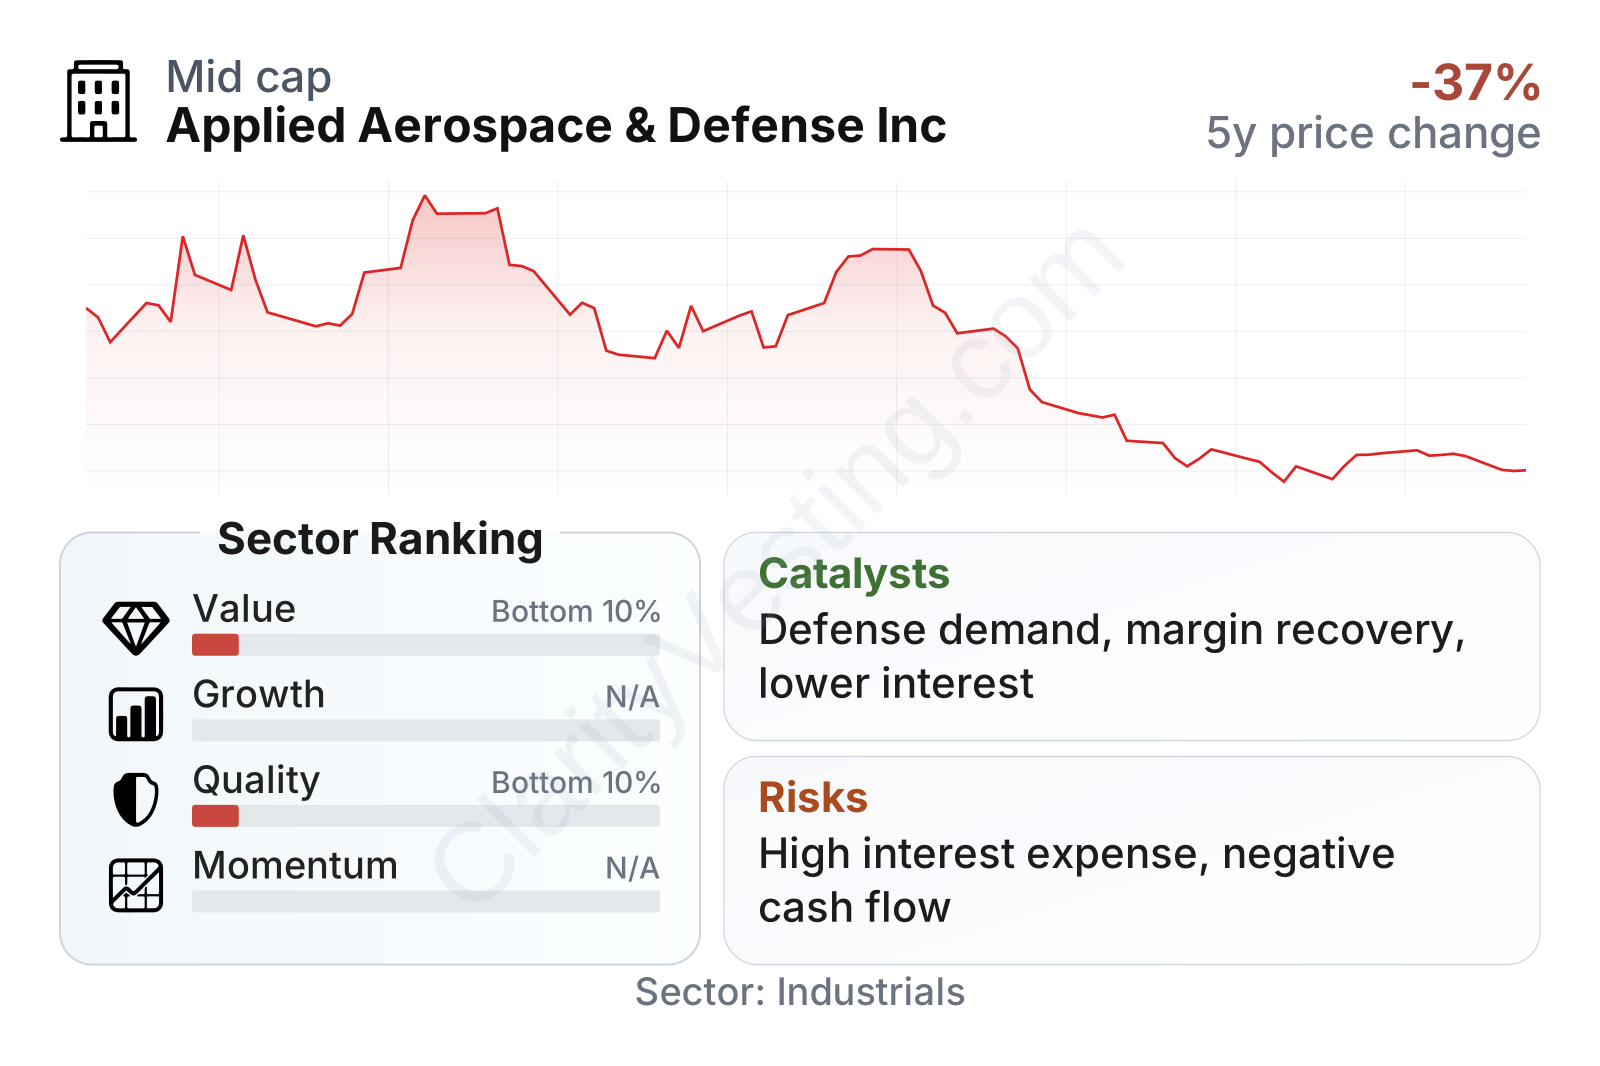
The recent picture is mixed. On one side, revenue growth has been far faster than the sector median, showing that the company is not stagnant. On the other, profitability and cash generation are currently weak relative to most aerospace and defense peers. Operating margin and profit margin are negative, free cash flow is negative, and valuation measures tied to earnings and cash flow look unattractive because the company is not presently converting growth into durable profits.
The balance sheet is not the most stretched in the sector on a debt-to-equity basis, at roughly 52% versus a higher sector median, but net debt relative to assets is elevated and interest burden is the real issue. That helps explain why the market value has fallen notably in recent months: the stock moved down from around $19 in early June 2026 to about $12 by early September 2026, signaling a meaningful reset in market expectations.
Growth
The company operates in a sector that still has long-term structural support. Defense budgets in the United States and allied countries remain underpinned by modernization needs, supply chain localization, munitions replenishment, aerospace platform upgrades, and demand for specialized materials and mission equipment. Businesses that can supply qualified components into long-life defense and aerospace programs can benefit from contracts that extend over several years.
Applied Aerospace & Defense also appears positioned in niches where certification, manufacturing know-how, and customer approval processes create barriers to entry. That can support growth if the company keeps winning work on existing programs and adds content on newer platforms. Its recent revenue jump suggests either acquisition-related expansion, stronger program demand, or both. In that sense, the company’s strategy has a clear industrial logic: scale up in specialized segments where technical requirements can limit the field of competitors.
A practical growth catalyst is the gap between operating performance and net earnings. The company already produced positive operating income in 2025, so if financing costs decline over time, a meaningful portion of operating improvement could begin to show up in net income and cash flow. Another potential catalyst is any new contract awards, backlog growth, or successful integration of acquired operations that lifts margins rather than just revenue.
Recent public company communications and filings are especially important here because this is not a simple volume story. For this business, growth quality matters more than growth alone: whether new sales carry healthy margins, whether they are tied to repeat programs, and whether working capital requirements remain manageable.
Risks
This article is for informational purposes only and does not constitute financial advice. Some content is AI-generated. See Disclaimer


