Stock Analysis · Agilent Technologies Inc (A)
Overview
Agilent Technologies is a laboratory tools and diagnostics company serving pharmaceutical manufacturers, biotechnology firms, academic and government laboratories, environmental testing providers, food testing labs, and clinical customers. In simple terms, it sells the instruments, software, consumables, and services that scientists and regulated labs use to analyze samples, develop drugs, monitor quality, and run diagnostic workflows.
The business is built around recurring laboratory demand rather than one-time consumer purchases. A large part of Agilent’s activity comes from installed instruments that later require replacement parts, columns, reagents, maintenance, and compliance support. That creates a steadier revenue base than a business that depends only on new equipment sales.
Based on the company’s recent annual reporting structure, Agilent’s main revenue sources are approximately:
- Life Sciences and Applied Markets Group: about 46% of revenue. This segment includes analytical instruments and related products used in pharmaceutical, chemical, environmental, food, and advanced materials testing. Key categories include liquid chromatography, gas chromatography, mass spectrometry, spectroscopy, and laboratory software.
- Agilent CrossLab Group: about 33% of revenue. This business provides laboratory services, consumables, informatics, repair, compliance support, and asset management. It is important because it is tied to the installed base and often brings recurring demand.
- Diagnostics and Genomics Group: about 21% of revenue. This segment includes pathology, companion diagnostics, genomics, nucleic acid manufacturing, and cell analysis solutions used in clinical and biopharma settings.
Agilent is not the largest healthcare company, but it is a sizable and well-established player in specialized lab infrastructure. Financially, the company has remained profitable through changing demand cycles, and over the last several years gross profit has stayed above $3.4 billion while net income has generally held around $1.2 billion to $1.3 billion, showing resilience even when revenue softened.
The overall picture is a company with a high-margin business mix, meaningful recurring revenue from services and consumables, and broad exposure to research, quality control, and diagnostics rather than dependence on a single product line.
Key Figures
| Metric | Value | Sector ⓘ |
|---|---|---|
| Date | Oct 24, 2026 | |
| Context | ||
| Sector | Healthcare | |
| Industry | Diagnostics & Research | |
| Market Cap ⓘ | $50.12B | |
| Beta ⓘ | 1.21 | |
Value (Cheapness) | ||
| P/E Ratio ⓘ | 34.12 | 25.42 |
| P/B Ratio ⓘ | 6.68 | 3.08 |
| FCF Yield ⓘ | 2.87% | 3.12% |
| Dividend Yield ⓘ | 0.59% | 1.85% |
| EBIT / EV ⓘ | 3.61% | 0.56% |
| PEG ⓘ | 1.37 | |
Growth (Business expansion) | ||
| Revenue Growth ⓘ | 8.10% | 7.50% |
| RPS Growth (5Y CAGR) ⓘ | 4.41% | 8.60% |
| EPS Growth (5Y CAGR) ⓘ | -4.00% | -17.73% |
| BVPS Growth (5Y CAGR) ⓘ | 7.83% | 3.72% |
| Margin Growth (5Y Trend) ⓘ | -0.54% | -0.57% |
| FCF Growth (5Y CAGR) ⓘ | -2.90% | 0.96% |
| DPS Growth (5Y CAGR) ⓘ | 6.61% | 6.69% |
Quality (Business durability) | ||
| ROIC (Latest) ⓘ | 14.54% | 3.17% |
| ROA (Latest) ⓘ | 10.79% | 2.98% |
| ROIC (5Y Median) ⓘ | 15.94% | 4.56% |
| ROA (5Y Median) ⓘ | 11.65% | 1.87% |
| Net Debt / EBIT (Latest) ⓘ | 1.24 | 1.34 |
| Net Debt / EBIT (5Y Median) ⓘ | 1.01 | 1.86 |
| Net Debt / EBITDA (Latest) ⓘ | 1.08 | 1.00 |
| Net Debt / Assets ⓘ | 15.69% | 5.06% |
| EBITDA / Interest ⓘ | 19.20 | 9.55 |
| Operating Margin (Latest) ⓘ | 23.93% | 9.25% |
| Operating Margin (5Y Median) ⓘ | 22.80% | 7.33% |
| Debt to Equity (Latest) ⓘ | 53.63% | 26.68% |
| Profit Margin (Latest) ⓘ | 19.53% | 3.34% |
| Free Cash Flow (Latest) ⓘ | $1.44B | |
Momentum (Price trend) | ||
| 3Y Return ⓘ | +62.62% | +51.61% |
| 12M Return (excl. last month) ⓘ | +33.46% | +19.90% |
| 6M Return ⓘ | +44.84% | +10.10% |
| Price vs. 200-Day MA ⓘ | +29.05% | +6.44% |
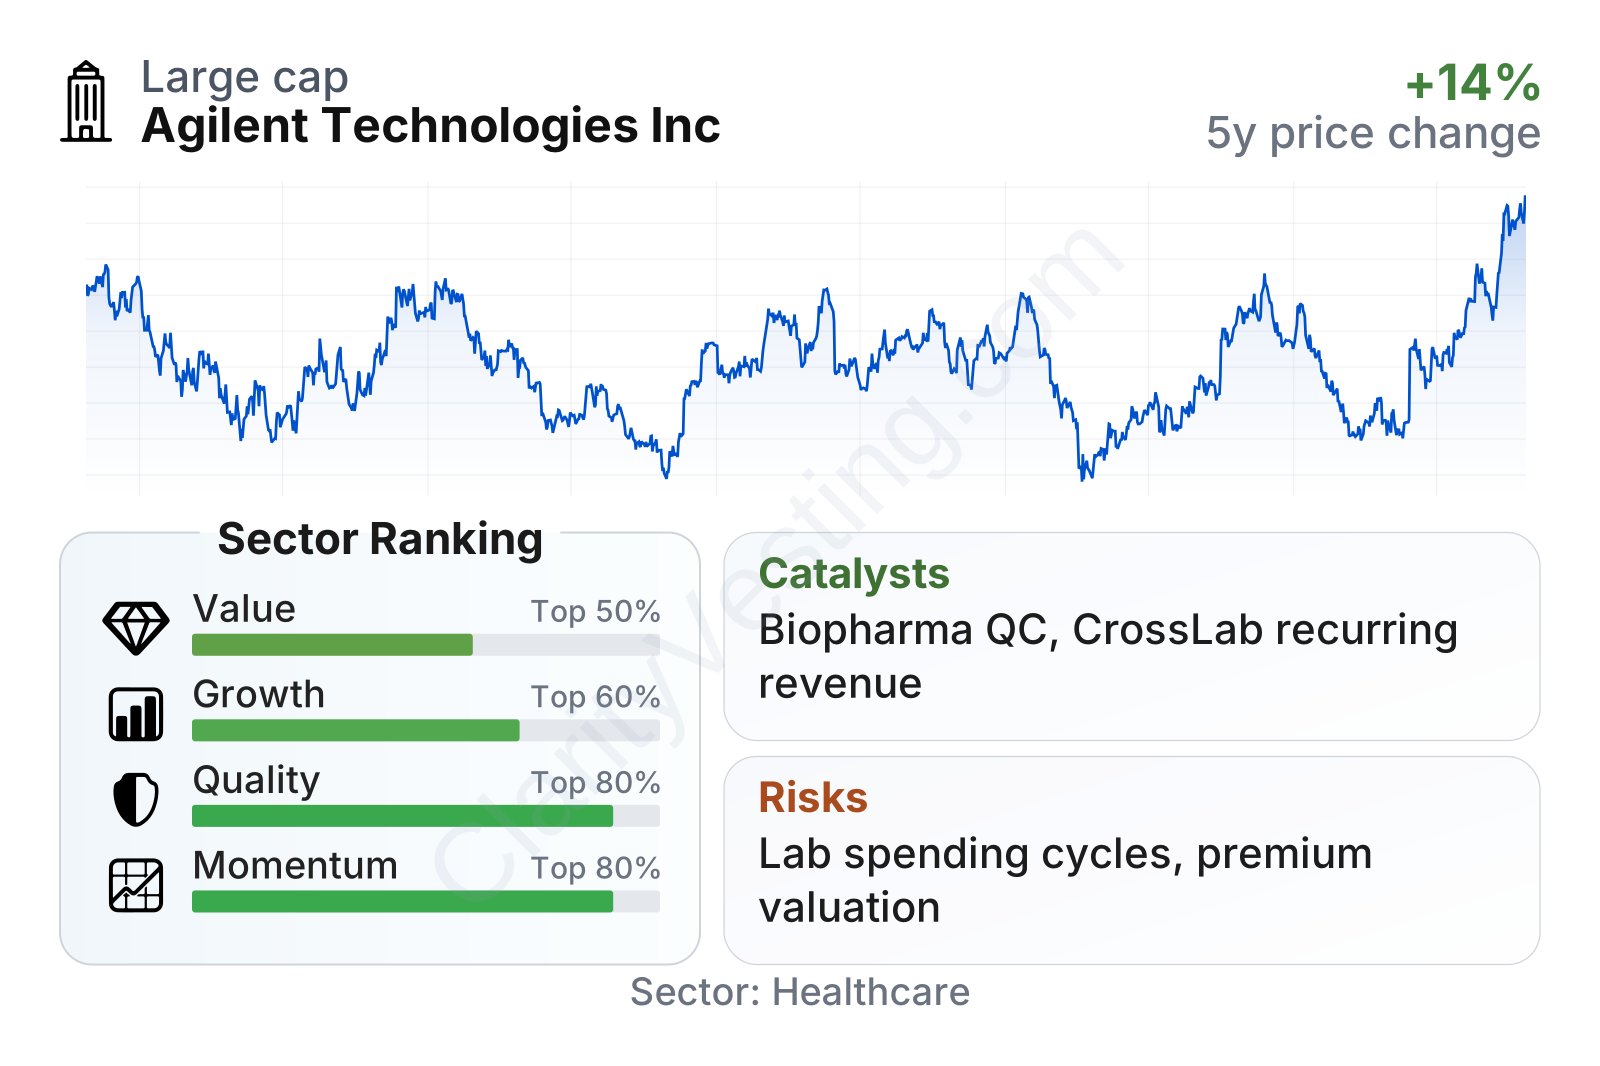
Agilent stands out more for quality and operating consistency than for cheap valuation. Profitability metrics are comfortably above much of the healthcare tools universe, and returns on assets and long-term operating margins indicate a disciplined business. Growth is respectable rather than exceptional, while the stock’s recent price performance has been stronger than the sector median. On valuation factors, however, the shares screen less attractively, with earnings and book multiples above sector norms and a modest dividend yield.
The stock history also shows that this is not a low-volatility name. It has gone through several drawdowns since 2021, including a sharp decline in 2025 before recovering. That pattern fits a company tied to capital spending and research budgets: operationally resilient, but still sensitive to changes in market sentiment and lab demand.
Growth
Agilent operates in parts of healthcare and laboratory science that should keep expanding over the long run. Drug development is becoming more complex, biologics and cell therapies require advanced analytical tools, laboratories face tighter quality and regulatory requirements, and food, environmental, and chemical testing remain essential. Those are durable demand drivers rather than short-lived trends.
The company’s strategy also makes sense for long-term expansion because it combines instruments with higher-frequency consumables, software, and service contracts. That mix can reduce cyclicality over time. CrossLab is especially important here: once a laboratory standardizes around Agilent systems, ongoing support and replacement products can continue for years. In diagnostics and genomics, Agilent also has exposure to pathology and companion diagnostics, areas that benefit from more personalized treatment approaches.
Revenue momentum weakened in 2023 and much of 2024, then improved noticeably. More recent year-over-year growth has returned to positive mid- to high-single-digit territory, slightly ahead of the sector median. That suggests the downcycle in lab spending has eased, although the recovery is not perfectly smooth and should still be viewed as cyclical rather than linear.
Cash generation remains an important part of the case, even if it has not moved in a straight line. Free cash flow has fluctuated from roughly $1.0 billion to $1.6 billion in recent periods. That is still a meaningful level for a company of Agilent’s size and gives it flexibility for acquisitions, dividends, share repurchases, and internal investment. The weaker recent cash flow trend is worth monitoring, but the business continues to convert a substantial portion of earnings into cash.
A notable growth catalyst is Agilent’s positioning in biopharma quality control and regulated lab workflows. These areas tend to require validation, reliability, and service depth, which can favor established suppliers over smaller entrants. Recent company communications have also emphasized demand improvement in instruments and continued momentum in service-related offerings, pointing to a business that may benefit if pharma and biotech spending remains stable or improves further.
Risks
This article is for informational purposes only and does not constitute financial advice. Some content is AI-generated. See Disclaimer


