Stock Analysis · Zillow Group Inc (Z)
Overview
Zillow Group operates one of the best-known online real estate platforms in the United States. Its websites and apps help people search for homes, connect with real estate agents, obtain mortgage information, and increasingly move through more of the transaction process in one place. After exiting its home-flipping business several years ago, the company has refocused on a simpler model built around digital housing traffic, software tools, advertising, and transaction services.
The business is centered on what management calls a “housing super app” strategy: bringing search, touring, financing, agent connection, rental discovery, and closing-related services into one ecosystem. In plain terms, Zillow wants to be the main doorway consumers use when they think about moving.
Based on recent company reporting, Zillow’s revenue mainly comes from these areas:
- Residential services, especially Premier Agent and related marketplace revenue: roughly the largest contributor, around half of total revenue or a bit more. This is mainly advertising and lead-generation revenue from real estate agents and brokers paying for customer connections.
- Rentals: a meaningful and growing business, roughly around one-fifth to one-quarter of revenue. This includes multifamily property advertising, rental listings, and related products for property managers.
- Mortgages: a smaller but strategically important contribution, generally in the high-single-digit to low-teens percentage range depending on market conditions. This includes mortgage origination and marketplace activity.
- Other for-sale and transaction services: the remainder, including offerings tied to touring, title and escrow-related partnerships, and software tools for real estate professionals.
Zillow’s revenue mix matters because it shows a business that is still heavily dependent on the for-sale housing market, but with a broader platform than a pure home-listings website. That diversification has become more important as high mortgage rates have kept U.S. home sales subdued.
The company’s overall cost structure also points to a platform model with high gross margins but meaningful spending on product development and customer acquisition. Over the last several years, gross profit has remained strong while profitability has depended largely on whether revenue growth can outpace heavy operating expenses. The latest annual pattern looks better than the previous loss-making years, with revenue recovering and operating income turning positive.
The broad takeaway is that Zillow is no longer trying to earn money from owning homes; it is trying to earn money from being the digital infrastructure around housing transactions.
Key Figures
| Metric | Value | Sector ⓘ |
|---|---|---|
| Date | Sep 12, 2026 | |
| Context | ||
| Sector | Communication Services | |
| Industry | Internet Content & Information | |
| Market Cap ⓘ | $7.31B | |
| Beta ⓘ | 1.98 | |
Value (Cheapness) | ||
| P/E Ratio ⓘ | 141.30 | 18.61 |
| FCF Yield ⓘ | 3.42% | 13.68% |
| EBIT / EV ⓘ | 1.13% | 4.54% |
| PEG ⓘ | 0.93 | |
Growth (Business expansion) | ||
| Revenue Growth ⓘ | 17.90% | 5.40% |
| RPS Growth (5Y CAGR) ⓘ | 4.48% | 4.62% |
| EPS Growth (5Y CAGR) ⓘ | -9.87% | -18.01% |
| Margin Growth (5Y Trend) ⓘ | N/A | 1.10% |
| FCF Growth (5Y CAGR) ⓘ | N/A | 5.88% |
Quality (Business durability) | ||
| ROIC (Latest) ⓘ | 1.42% | 8.38% |
| ROIC (5Y Median) ⓘ | -0.48% | 8.32% |
| Net Debt / EBIT (Latest) ⓘ | -0.18 | 1.99 |
| Net Debt / EBIT (5Y Median) ⓘ | N/A | 2.94 |
| Operating Margin (Latest) ⓘ | 2.78% | 14.89% |
| Operating Margin (5Y Median) ⓘ | -2.55% | 12.96% |
| Debt to Equity (Latest) ⓘ | 12.95% | 59.59% |
| Profit Margin (Latest) ⓘ | 1.96% | 8.77% |
| Free Cash Flow (Latest) ⓘ | $250.00M | |
Momentum (Price trend) | ||
| 3Y Return ⓘ | -37.28% | +46.64% |
| 12M Return (excl. last month) ⓘ | -58.51% | +2.16% |
| 6M Return ⓘ | -21.21% | +5.05% |
| Price vs. 200-Day MA ⓘ | -29.48% | +2.88% |
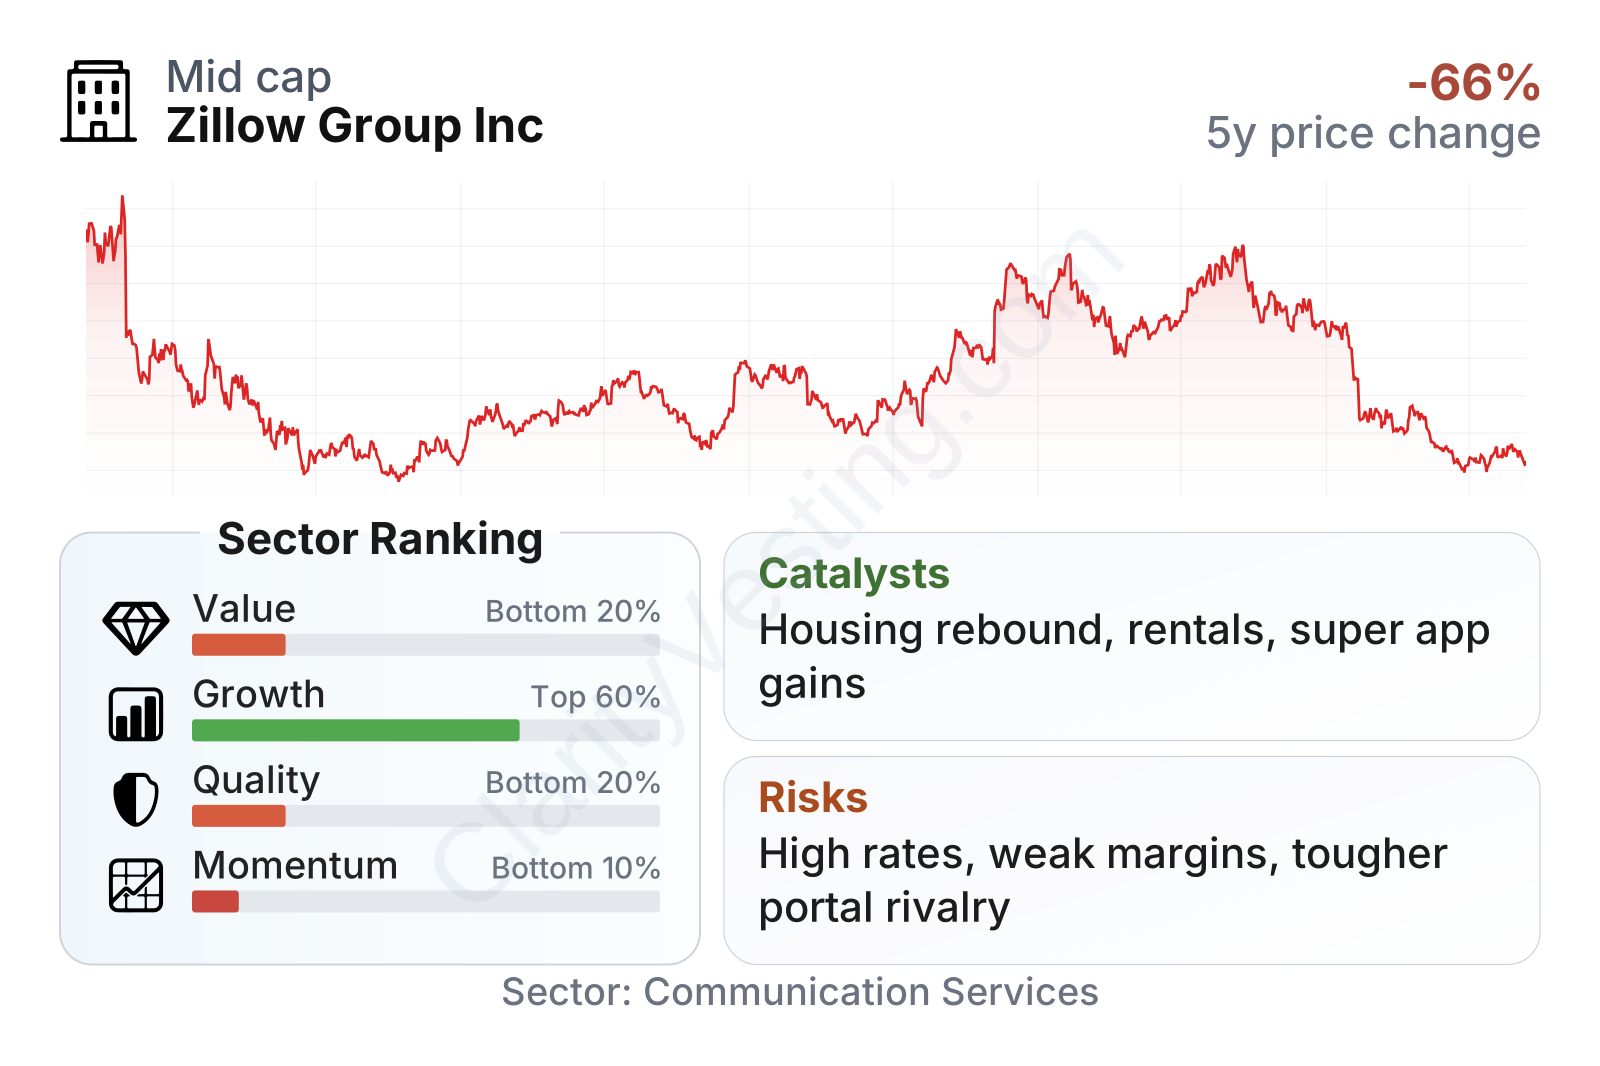
Zillow currently sits in a mixed position. Growth is better than the sector median, supported by revenue expansion that is running well ahead of many peers. At the same time, quality and momentum rank weakly. Profitability has improved from earlier losses, but margins and returns on capital are still modest for an internet platform. The balance sheet is a clear bright spot: leverage is low, net debt is negative, and free cash flow remains positive. Market volatility is also high, which fits the stock’s uneven price history over the last several years.
The stock chart reflects that instability. Shares have moved from pandemic-era enthusiasm to a long reset, followed by a partial recovery and then another sharp decline in early 2026. That pattern suggests the market still views Zillow as highly sensitive to both housing conditions and confidence in its longer-term execution.
Growth
Zillow operates in a sector with long-term structural relevance. Housing is a very large market, and the process of buying, renting, financing, and moving remains fragmented and often inefficient. That creates room for digital platforms that can simplify the experience. Even in a slow housing market, the broader shift toward online discovery, self-service tools, integrated transaction workflows, and AI-assisted search supports the category over time.
Zillow’s strategy makes sense if viewed through that lens. Rather than relying only on listing traffic, the company is trying to monetize more moments in the customer journey. Search traffic can feed agent connections, touring, financing, rental leads, and software tools for industry professionals. If that ecosystem deepens, each consumer visit becomes more valuable even when home sales volumes are under pressure.
Recent revenue growth has clearly improved. After a deep post-housing-boom reset, the company has put together several quarters of double-digit year-over-year expansion, with the latest pace near the high teens. That is a healthier trajectory than the sector median and suggests Zillow is gaining traction despite a difficult backdrop for existing-home transactions.
Cash generation also deserves attention. Free cash flow swung sharply after the business reset and has stabilized back into positive territory, with the trailing twelve months showing a solid rebound from prior lows. For a company still rebuilding margins, that matters because it gives management flexibility to keep investing in product and customer experience without depending heavily on outside financing.
Two potential catalysts stand out. First, any broad improvement in U.S. housing turnover would likely help Zillow because agent advertising, mortgage activity, and transaction services all benefit from more consumers moving. Second, the company continues to build out a more integrated transaction platform, including enhanced touring, financing connections, and tools designed to keep users inside Zillow’s ecosystem longer. If execution improves in these areas, revenue per customer interaction could rise even before the housing market fully normalizes.
Recent company updates have also emphasized rentals and seller solutions as areas of opportunity. Rentals can offer a steadier source of activity than the cyclical home-sales market, while deeper seller and buyer workflow tools could increase Zillow’s role in transactions rather than just the search phase.
Risks
This article is for informational purposes only and does not constitute financial advice. Some content is AI-generated. See Disclaimer


