Stock Analysis · Wynn Resorts Limited (WYNN)
Overview
Wynn Resorts Limited is a luxury hospitality and gaming company. It owns and operates high-end casino resorts that combine hotel rooms, gaming floors, restaurants, retail, entertainment, nightlife, meeting space, and in some markets sports betting or other digital gaming activities. Its best-known properties are in Macau and Las Vegas, and the group has also been developing its presence in the Middle East through the Wynn Al Marjan Island project in the United Arab Emirates.
The business is driven mainly by destination resorts, where customers spend across several categories during the same visit. In practice, gaming is the core economic engine, while hotel stays, food and beverage, and other on-property spending support the premium positioning of the brand.
Based on recent company reporting, Wynn’s revenue mix is dominated by Macau, with Las Vegas as the second pillar. By business line, casino revenue remains the largest source.
- Casino revenue: approximately 70% to 75% of total revenue. This includes table games and slot machines, with a large contribution from Macau mass-market play and premium segments.
- Rooms: approximately 8% to 10%. This comes from hotel accommodations at Wynn and Encore properties.
- Food and beverage: approximately 7% to 9%. This includes restaurants, bars, lounges, banquets, and catering.
- Entertainment, retail, and other: approximately 8% to 12%. This generally includes shopping, theater or nightlife, parking, resort fees, meeting space, and other guest services.
By geography, Macau appears to account for roughly 55% to 60% of group revenue in recent periods, Las Vegas around 30% to 35%, and the remainder from Boston and other operations. That concentration matters because Macau recovery and policy conditions have an outsized effect on group results.
The broad financial picture over the last several years shows a sharp recovery after the pandemic shock: revenue and operating profit improved materially from 2022 into 2024, while net income and cash generation became positive again. More recently, revenue has stayed high, but earnings have been less stable, showing that the recovery phase has largely passed and the next step depends more on execution and new growth drivers.
The business has rebuilt scale well, with revenue now far above the depressed pandemic years. Operating profitability also recovered strongly, but net income remains more sensitive because interest expense is still substantial for a company with a meaningful debt load.
Key Figures
| Metric | Value | Sector ⓘ |
|---|---|---|
| Date | Sep 12, 2026 | |
| Context | ||
| Sector | Consumer Cyclical | |
| Industry | Resorts & Casinos | |
| Market Cap ⓘ | $9.03B | |
| Beta ⓘ | 0.99 | |
Value (Cheapness) | ||
| P/E Ratio ⓘ | 21.03 | 17.10 |
| FCF Yield ⓘ | 8.77% | 8.53% |
| EBIT / EV ⓘ | 6.78% | 6.46% |
| PEG ⓘ | 0.79 | |
Growth (Business expansion) | ||
| Revenue Growth ⓘ | 6.90% | 5.75% |
| RPS Growth (5Y CAGR) ⓘ | 19.94% | 9.14% |
| EPS Growth (5Y CAGR) ⓘ | N/A | -18.21% |
| Margin Growth (5Y Trend) ⓘ | 26.75% | -0.23% |
| FCF Growth (5Y CAGR) ⓘ | N/A | 4.91% |
Quality (Business durability) | ||
| ROIC (Latest) ⓘ | 10.69% | 12.61% |
| ROIC (5Y Median) ⓘ | 8.81% | 10.72% |
| Net Debt / EBIT (Latest) ⓘ | 8.21 | 2.10 |
| Net Debt / EBIT (5Y Median) ⓘ | 9.50 | 2.32 |
| Operating Margin (Latest) ⓘ | 17.69% | 9.25% |
| Operating Margin (5Y Median) ⓘ | 15.87% | 9.64% |
| Debt to Equity (Latest) ⓘ | -7283.79% | 75.78% |
| Profit Margin (Latest) ⓘ | 6.05% | 5.33% |
| Free Cash Flow (Latest) ⓘ | $792.32M | |
Momentum (Price trend) | ||
| 3Y Return ⓘ | -5.11% | +14.53% |
| 12M Return (excl. last month) ⓘ | -7.62% | +3.08% |
| 6M Return ⓘ | -10.77% | +0.55% |
| Price vs. 200-Day MA ⓘ | -17.30% | -0.54% |
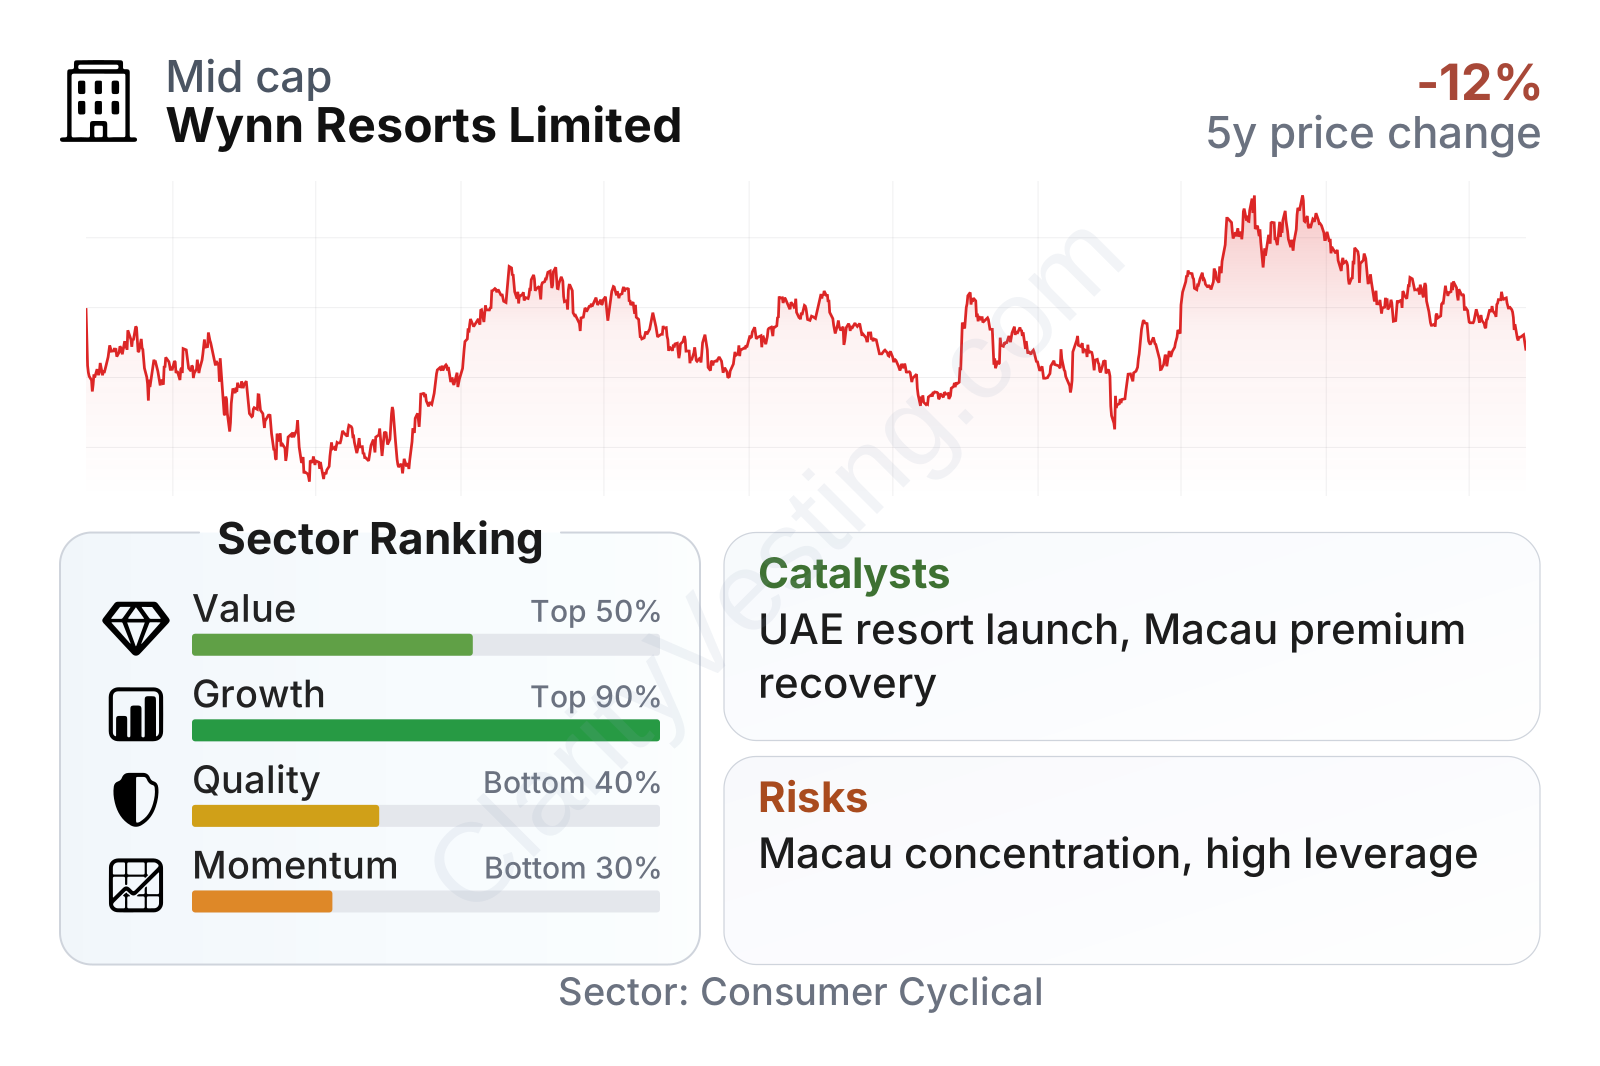
Wynn is a large but not mega-cap company in consumer discretionary, and its share price has been volatile over the last few years. The operating profile is stronger than the stock’s recent momentum suggests: growth ranks high within the sector, margins are healthy, but balance-sheet leverage weakens the overall quality picture. The valuation profile is mixed, with earnings multiples above the sector median while some cash-based measures look closer to normal.
The stock history also shows how tightly Wynn trades with changes in sentiment around Macau demand, travel recovery, and broader discretionary spending. That helps explain why the business fundamentals and stock performance have not moved in the same direction every year.
Growth
Wynn operates in a sector with long-term growth potential, but it is not a simple straight-line growth industry. Global tourism, premium travel, integrated resorts, and regulated gaming have room to expand over time, especially in Asia and newer jurisdictions. The main attraction is that well-located luxury resorts can keep monetizing the same guest across many spending categories, which can lift returns when occupancy and visitation are strong.
Wynn’s strategy is logical for that environment. The company focuses on the luxury end of the market, where brand, service standards, and property quality can support premium pricing. In Macau, that matters because the market is recovering with a stronger emphasis on mass-premium and non-gaming tourism. In Las Vegas, the company benefits from a high-end customer base, convention demand, and premium room rates. This positioning does not make Wynn the largest operator, but it gives the company a clear niche.
Recent revenue growth has moderated from the post-reopening surge to more normal levels, but it is still slightly ahead of the sector median. That suggests the business is no longer in a rebound-only phase; future expansion will likely depend more on market share, mix, and new assets than on easy comparisons.
Cash generation has improved dramatically since 2022, moving from negative territory to solid positive free cash flow. The latest trend is somewhat lower than the peak reached during the strongest recovery period, but it remains substantial. That is important because cash flow is what can ultimately support debt reduction, capital spending, and future flexibility.
The most important catalyst is the Wynn Al Marjan Island resort in the UAE. This project gives Wynn exposure to a new high-end destination market where legal integrated resort development is still at an early stage. If the property opens on schedule and demand develops as expected, it could become a meaningful new earnings platform and reduce the group’s dependence on Macau and Las Vegas alone.
Another growth support is Macau itself. The city remains one of the world’s most valuable gaming markets, and Wynn’s properties are well positioned in the premium segment. Continued normalization in visitation, hotel occupancy, and customer spend can still lift results, even if the explosive rebound phase is over.
Recent company updates have also pointed to continued development progress in the UAE and ongoing capital returns, both of which indicate management sees the business as firmly back in cash-producing mode. That does not remove cyclicality, but it does show a company operating from a more stable base than it had a few years ago.
Risks
This article is for informational purposes only and does not constitute financial advice. Some content is AI-generated. See Disclaimer


