Stock Analysis · Wynn Macau Ltd (WYNMF)
Overview
Wynn Macau Ltd is a luxury casino and hotel operator focused on Macau, the world’s largest gambling hub by gaming revenue. The company runs two main integrated resorts: Wynn Macau on the Macau peninsula and Wynn Palace in Cotai. These properties combine casino gaming with hotel rooms, restaurants, retail space, entertainment, and convention facilities. Wynn Macau Ltd is controlled by Wynn Resorts and is listed in Hong Kong, while WYNMF trades over the counter in the United States.
The business makes most of its money from casino activity, with non-gaming operations acting as an important support for premium positioning and customer retention. Based on recent annual reporting, revenue is heavily concentrated in a small number of categories.
- Casino revenue: about 85% to 90%. This includes VIP baccarat, mass-market table games, and slot machines. Mass-market gaming has become more important across Macau since the regulatory reset and changing customer mix.
- Rooms: about 3% to 5%. This covers hotel accommodations at Wynn Macau and Wynn Palace, both positioned in the luxury segment.
- Food and beverage: about 3% to 4%. This includes restaurants, bars, and in-resort dining.
- Retail, entertainment, and other: about 4% to 7%. This includes leased luxury retail, attractions, and other resort services.
This revenue mix shows a business that is still overwhelmingly tied to gambling demand in Macau, even though management has been investing in tourism, events, and premium hospitality to align with Macau’s policy push toward broader non-gaming attractions.
The financial flow over the past few years also reflects a sharp recovery pattern: revenue and operating profit rebounded strongly after the pandemic disruption, although earnings remain sensitive to interest costs and swings in visitation and gaming volume.
Key Figures
| Metric | Value | Sector ⓘ |
|---|---|---|
| Date | Sep 05, 2026 | |
| Context | ||
| Sector | Consumer Cyclical | |
| Industry | Resorts & Casinos | |
| Market Cap ⓘ | $3.93B | |
| Beta ⓘ | 0.87 | |
Value (Cheapness) | ||
| P/E Ratio ⓘ | 10.71 | 17.51 |
| FCF Yield ⓘ | 172.49% | 8.30% |
| EBIT / EV ⓘ | N/A | 6.34% |
| PEG ⓘ | 0.42 | |
Growth (Business expansion) | ||
| Revenue Growth ⓘ | 14.40% | 5.90% |
| RPS Growth (5Y CAGR) ⓘ | 8.20% | 9.14% |
| EPS Growth (5Y CAGR) ⓘ | N/A | -17.43% |
| Margin Growth (5Y Trend) ⓘ | 50.16% | -0.30% |
| FCF Growth (5Y CAGR) ⓘ | N/A | 4.91% |
Quality (Business durability) | ||
| ROIC (Latest) ⓘ | N/A | 12.33% |
| ROIC (5Y Median) ⓘ | 12.29% | 10.68% |
| Net Debt / EBIT (Latest) ⓘ | 4.68 | 2.11 |
| Net Debt / EBIT (5Y Median) ⓘ | 8.26 | 2.32 |
| Operating Margin (Latest) ⓘ | 18.93% | 9.12% |
| Operating Margin (5Y Median) ⓘ | 17.83% | 9.56% |
| Debt to Equity (Latest) ⓘ | -347.01% | 75.78% |
| Profit Margin (Latest) ⓘ | 9.52% | 5.31% |
| Free Cash Flow (Latest) ⓘ | $6.78B | |
Momentum (Price trend) | ||
| 3Y Return ⓘ | -10.05% | +15.88% |
| 12M Return (excl. last month) ⓘ | -1.48% | +5.17% |
| 6M Return ⓘ | +4.24% | 0.00% |
| Price vs. 200-Day MA ⓘ | +2.47% | +0.59% |
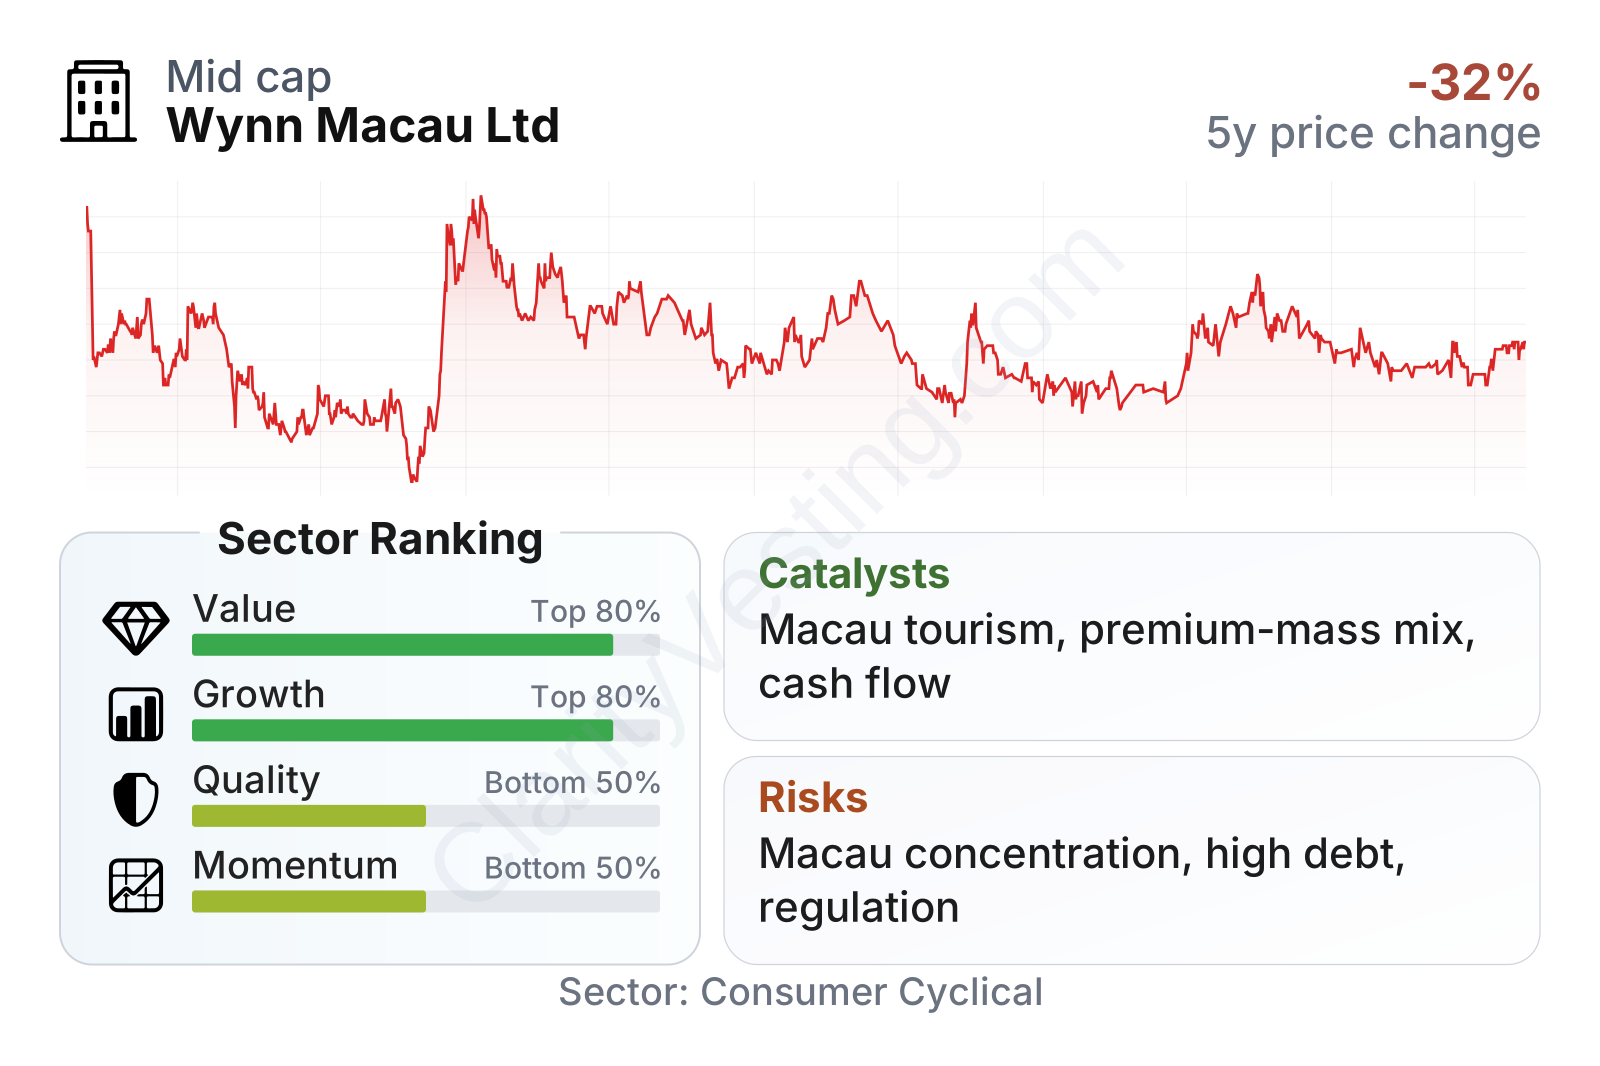
Wynn Macau is a mid-sized public company in market value terms, with share-price behavior that has been volatile but not unusually aggressive versus the broader market, as suggested by a beta below 1. The factor profile is mixed. Value and growth indicators rank well versus much of the consumer cyclical sector, helped by revenue growth above the sector median, a low PEG ratio, and unusually strong free cash flow yield. Quality is weaker overall because leverage remains elevated, even though operating margins are stronger than the sector median. Momentum is still soft on a longer view, which matches the uneven recovery in Macau travel and gaming demand.
Growth
Wynn Macau operates in a sector with clear long-term demand, but also with more cyclicality than many consumer businesses. Macau remains one of the most important gaming destinations in the world, and the company is positioned at the premium end of the market. That matters because luxury customers generally spend across several categories at once: gaming, rooms, dining, and shopping. As tourism normalizes and infrastructure improves in the Greater Bay Area, premium integrated resorts can benefit from both higher visitation and higher spending per visitor.
The company’s strategy broadly fits the direction set by Macau’s regulators. Concession renewals came with stronger expectations around non-gaming investment, entertainment, events, and international tourism. Wynn Macau has been expanding attractions and guest experiences rather than relying only on casino capacity. That does not change the fact that gaming remains the economic engine, but it can improve resilience and help the company stay aligned with government priorities.
Growth has been real, but not smooth. After the powerful rebound that followed Macau’s reopening, year-over-year comparisons became much tougher, and recent revenue growth has cooled materially. That slowdown does not necessarily mean the recovery has ended; it suggests the easy phase of reopening-driven growth is over and the next phase depends more on market-share execution, premium demand, and broader tourism development.
Cash generation remains one of the more encouraging parts of the picture. Free cash flow has stayed substantial, even if it has pulled back from peak recovery levels. For a resort operator, that is important because it supports maintenance spending, non-gaming investments, and debt management without depending entirely on external financing.
A meaningful catalyst is Macau’s continuing effort to widen its visitor base beyond traditional high-roller gaming. Improved transport links, more events, and stronger tourism integration with mainland China can all support visitation. Wynn’s brand also gives it a good chance to capture premium customers as travel patterns normalize further. Another potential opportunity is continued mix improvement toward mass-premium and premium-mass gaming, which tends to be structurally healthier than the old junket-heavy VIP model.
Risks
This article is for informational purposes only and does not constitute financial advice. Some content is AI-generated. See Disclaimer


