Stock Analysis · Winmark Corporation (WINA)
Overview
Winmark Corporation is a franchisor focused on resale retail. Instead of operating a large chain of company-owned stores, it licenses brands to franchisees who run local shops. Its best-known concepts include Plato’s Closet, Once Upon A Child, Play It Again Sports, Style Encore, and Music Go Round. The company also has a small leasing business that helps franchisees finance equipment, fixtures, and startup needs.
This model matters because it is lighter than a traditional retailer. Franchisees provide most of the store-level capital and day-to-day operations, while Winmark mainly earns fees tied to franchise activity. That helps explain why the business can produce unusually high margins compared with most specialty retail companies.
The main sources of revenue are broadly the following, ranked from largest to smallest based on recent annual filings:
- Franchise royalties and fees: roughly 70% to 75% of revenue. This includes ongoing royalty income from franchise stores, initial franchise fees, renewals, and other brand-related fees.
- Leasing income: roughly 20% to 25% of revenue. Winmark’s middle-market leasing operation supports franchisees and other customers with equipment financing.
- Merchandise sales and other income: roughly 3% to 8% of revenue. This is the smallest segment and includes items such as supplies or other miscellaneous revenue streams.
The business is tied to secondhand retail, a category that benefits from two long-running consumer trends: value-seeking households and rising interest in reuse and sustainability. The brand mix also spreads exposure across children’s goods, teen apparel, sporting goods, women’s fashion, and musical instruments.
Over the last several years, revenue has moved within a fairly narrow band while profitability remained exceptionally strong. Cost of revenue stays low because Winmark is not a conventional inventory-heavy retailer, and most of each sales dollar reaches gross profit.
Key Figures
| Metric | Value | Sector ⓘ |
|---|---|---|
| Date | Sep 12, 2026 | |
| Context | ||
| Sector | Consumer Cyclical | |
| Industry | Specialty Retail | |
| Market Cap ⓘ | $1.11B | |
| Beta ⓘ | 0.51 | |
Value (Cheapness) | ||
| P/E Ratio ⓘ | 28.20 | 17.10 |
| FCF Yield ⓘ | 3.90% | 8.53% |
| EBIT / EV ⓘ | 4.76% | 6.46% |
| PEG ⓘ | 1.41 | |
Growth (Business expansion) | ||
| Revenue Growth ⓘ | 7.60% | 5.75% |
| RPS Growth (5Y CAGR) ⓘ | 3.27% | 9.14% |
| EPS Growth (5Y CAGR) ⓘ | -18.76% | -18.21% |
| Margin Growth (5Y Trend) ⓘ | -1.04% | -0.23% |
| FCF Growth (5Y CAGR) ⓘ | -1.79% | 4.91% |
Quality (Business durability) | ||
| ROIC (Latest) ⓘ | 224.92% | 12.61% |
| ROIC (5Y Median) ⓘ | 432.23% | 10.72% |
| Net Debt / EBIT (Latest) ⓘ | 0.66 | 2.10 |
| Net Debt / EBIT (5Y Median) ⓘ | 0.98 | 2.32 |
| Operating Margin (Latest) ⓘ | 63.28% | 9.25% |
| Operating Margin (5Y Median) ⓘ | 65.63% | 9.64% |
| Debt to Equity (Latest) ⓘ | -164.86% | 75.78% |
| Profit Margin (Latest) ⓘ | 47.09% | 5.33% |
| Free Cash Flow (Latest) ⓘ | $43.22M | |
Momentum (Price trend) | ||
| 3Y Return ⓘ | -10.75% | +14.53% |
| 12M Return (excl. last month) ⓘ | -11.41% | +3.08% |
| 6M Return ⓘ | -32.00% | +0.55% |
| Price vs. 200-Day MA ⓘ | -22.72% | -0.54% |
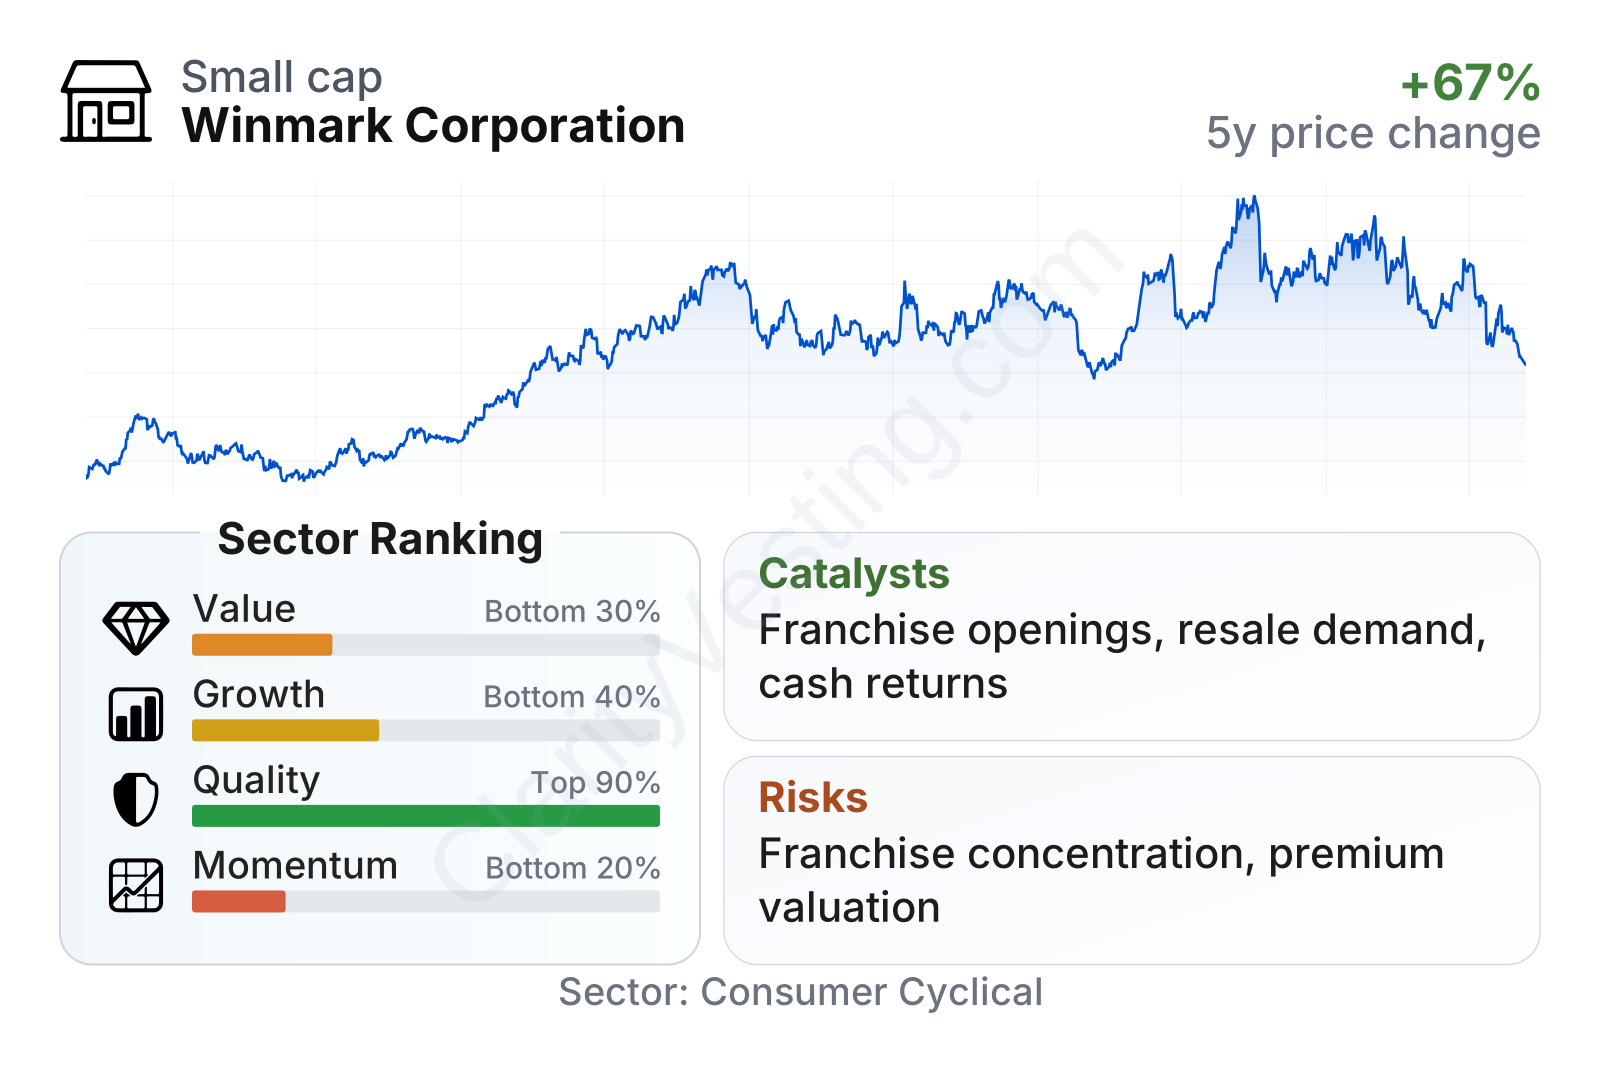
Winmark is a relatively small public company with a market value around $1.2 billion and a stock that has historically moved less than the broader market, as shown by its low beta. The company stands out on business quality: profitability, returns on capital, and balance-sheet efficiency are far stronger than the sector median. By contrast, value metrics look less attractive, with earnings and cash-flow multiples above many peers. Growth is mixed rather than explosive, and recent share-price momentum has been uneven after a strong multiyear run.
Growth
Winmark operates in a part of retail that has favorable long-term characteristics. Resale has become more mainstream as consumers look for lower prices, branded merchandise at a discount, and alternatives to full-price shopping. That broad category tailwind supports store openings, franchise demand, and steady royalty generation over time.
The company’s strategy is straightforward and sensible for a long-duration business. It expands primarily through franchising, which requires less capital than opening company-owned stores. That lowers financial risk and allows growth to come from adding locations, lifting store productivity, and increasing royalty income without large amounts of new investment by the parent company.
Revenue growth has not been perfectly smooth. There were periods of contraction in 2024 and again in early 2026, followed by a rebound. The latest year-over-year pace is still above the sector median, which suggests the business can return to growth even if results are somewhat lumpy quarter to quarter. Over a five-year view, however, the expansion rate is more modest, so the company looks more like a steady compounder than a rapid scaler.
Free cash flow has been consistently strong, staying in the low-$40 million range in recent years. That consistency is important because it supports dividends, buybacks, and operating flexibility. A notable catalyst is continued franchise unit growth across the main brands, especially where resale demand remains resilient. Another is the company’s ability to benefit when consumers trade down during tighter economic periods, which can make the model more defensive than many other consumer discretionary businesses.
Recent company updates have continued to highlight franchise development activity and store base expansion as key drivers. For a business of this size, even moderate net new store additions can have a visible effect on royalty income over time.
Risks
This article is for informational purposes only and does not constitute financial advice. Some content is AI-generated. See Disclaimer


