Stock Analysis · Verizon Communications Inc (VZ)
Overview
Verizon Communications is one of the largest telecommunications companies in the United States. Its core business is providing wireless and wireline connectivity to consumers, businesses, and public-sector customers. In simple terms, Verizon runs mobile networks, sells phone and data plans, connects homes and offices with broadband, and provides communications and network services to enterprises.
The business is organized mainly into two operating segments: Verizon Consumer and Verizon Business. Consumer is the larger engine, centered on wireless service and broadband for households. Business serves companies, government agencies, and wholesale customers with mobility, networking, security, and communications solutions.
Based on Verizon’s recent annual reporting, revenue is concentrated in a few major streams. Approximate shares of total revenue are as follows:
- Consumer wireless service: about 55% to 60% of total revenue. This includes monthly mobile service plans, data access, and related recurring wireless revenue from retail subscribers.
- Business wireless and wireline services: about 25% to 30%. This includes mobility services for enterprises, fixed network services, connectivity, security, and communications solutions.
- Wireless equipment sales: about 12% to 15%. This mainly reflects smartphones and other devices sold to customers, often with promotional activity affecting margins.
- Consumer wireline broadband and other services: about 5% to 8%. This includes Fios internet, fixed wireless access, and related home connectivity offerings.
That mix matters for long-term analysis because Verizon is mostly a recurring-revenue company. Monthly wireless bills are far more important than one-time device sales, which makes the business steadier than many technology companies, but also harder to grow quickly.
The broader financial picture shows a company with very large revenue, solid gross profit, and meaningful operating income, but also notable interest expense because telecom networks require heavy capital investment and significant borrowing. Revenue has been fairly stable in recent years, while profitability recovered after a weaker 2023 period.
Verizon’s revenue base has remained broadly stable, with total sales moving in a narrow range before improving again in 2025. The most visible shift in the income structure has been the rebound in operating and net income after 2023, even as interest expense stayed elevated, which underlines both the resilience of the core network business and the weight of financing costs.
Key Figures
| Metric | Value | Sector ⓘ |
|---|---|---|
| Date | Sep 12, 2026 | |
| Context | ||
| Sector | Communication Services | |
| Industry | Telecom Services | |
| Market Cap ⓘ | $207.61B | |
| Beta ⓘ | 0.24 | |
Value (Cheapness) | ||
| P/E Ratio ⓘ | 12.95 | 18.61 |
| FCF Yield ⓘ | 10.32% | 13.68% |
| EBIT / EV ⓘ | 7.35% | 4.54% |
| PEG ⓘ | 0.88 | |
Growth (Business expansion) | ||
| Revenue Growth ⓘ | -0.70% | 5.40% |
| RPS Growth (5Y CAGR) ⓘ | 0.36% | 4.62% |
| EPS Growth (5Y CAGR) ⓘ | -18.03% | -18.01% |
| Margin Growth (5Y Trend) ⓘ | -3.39% | 1.10% |
| FCF Growth (5Y CAGR) ⓘ | 1.11% | 5.88% |
Quality (Business durability) | ||
| ROIC (Latest) ⓘ | 8.38% | 8.38% |
| ROIC (5Y Median) ⓘ | 9.52% | 8.32% |
| Net Debt / EBIT (Latest) ⓘ | 6.46 | 1.99 |
| Net Debt / EBIT (5Y Median) ⓘ | 5.54 | 2.94 |
| Operating Margin (Latest) ⓘ | 20.82% | 14.89% |
| Operating Margin (5Y Median) ⓘ | 21.98% | 12.96% |
| Debt to Equity (Latest) ⓘ | 181.35% | 59.59% |
| Profit Margin (Latest) ⓘ | 11.64% | 8.77% |
| Free Cash Flow (Latest) ⓘ | $21.43B | |
Momentum (Price trend) | ||
| 3Y Return ⓘ | +81.92% | +46.64% |
| 12M Return (excl. last month) ⓘ | +16.04% | +2.16% |
| 6M Return ⓘ | +3.19% | +5.05% |
| Price vs. 200-Day MA ⓘ | +12.73% | +2.88% |
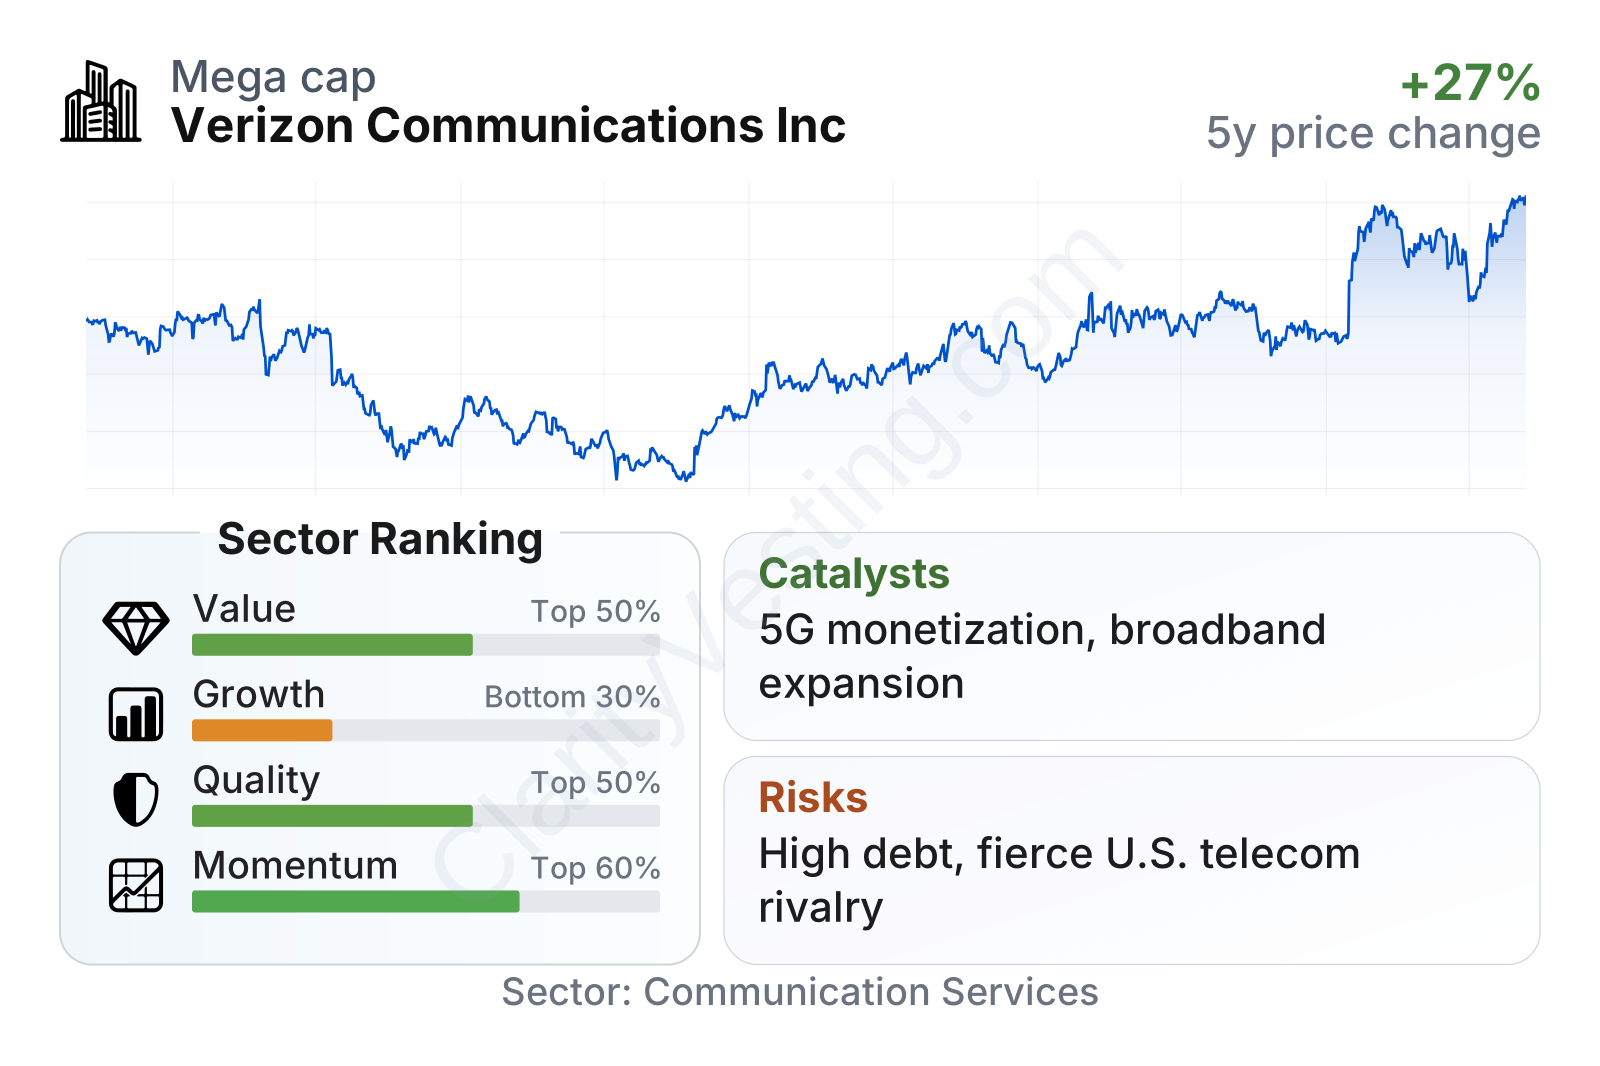
Verizon stands out as a very large, lower-volatility company within the Communication Services sector, with a beta near 0.24. The factor profile points to a business that looks stronger on profitability and operating efficiency than on expansion. Value metrics appear relatively undemanding versus the sector, while growth metrics rank below average. Quality is supported by operating margins above the sector median and returns on invested capital that are around sector norms or slightly better, but leverage remains meaningfully heavier than most peers.
The stock price path has also reflected that profile: a defensive name that went through a long reset from 2021 to 2023, then recovered through 2024 to 2026. That recovery suggests the market has become more comfortable with Verizon’s cash generation and earnings stability, even without a major acceleration in revenue.
Growth
Telecom is not a fast-growing industry in the United States, but it remains essential. Demand for mobile data, connected devices, home broadband, cloud connectivity, and private networks continues to rise over time. That gives Verizon exposure to a structurally important sector, even if growth tends to come in small increments rather than dramatic jumps.
Verizon’s strategy is centered on monetizing its network base more efficiently. The key pieces are premium wireless plans, fixed wireless access for home broadband, fiber expansion in selected markets, and deeper enterprise offerings such as private networks, network security, and edge-related services. This is a sensible approach for a mature telecom operator because it focuses on extracting more value from existing infrastructure rather than chasing risky expansion outside its core expertise.
Recent revenue growth has been uneven. Quarterly year-over-year growth moved between modest declines and low-single-digit gains for most of the past few years, with a stronger patch in 2025 before dipping slightly again in the latest period. That pattern fits the reality of a mature U.S. telecom market: Verizon can grow, but usually through pricing, mix, broadband additions, and customer retention rather than through rapid market expansion.
Free cash flow is one of Verizon’s more encouraging trends. Over the last several years it has climbed from roughly $10 billion to around $20 billion, showing that the business remains highly cash generative even when accounting earnings fluctuate. For a capital-intensive company, that matters a great deal because cash flow supports debt management, network investment, and shareholder distributions without requiring constant external financing.
A notable catalyst is broadband expansion outside the traditional wired footprint. Verizon has continued pushing fixed wireless access and fiber-based offerings, allowing it to compete for home internet customers in more markets. In business services, demand for secure connectivity, AI-related network traffic, and private wireless infrastructure could provide incremental growth, though likely not at a pace that transforms the company overnight.
Recent company communications have also emphasized continued 5G monetization, subscriber mix improvement, and disciplined capital allocation. None of these are dramatic on their own, but together they support the case for steady rather than explosive growth.
Risks
This article is for informational purposes only and does not constitute financial advice. Some content is AI-generated. See Disclaimer


