Stock Analysis · VeriSign Inc (VRSN)
Overview
VeriSign is a critical piece of the internet’s infrastructure. The company operates the authoritative registries for the .com and .net top-level domains and also provides related domain name registry services and internet root zone services. In simple terms, when a website uses a .com or .net ending, VeriSign is one of the companies helping keep that naming system running reliably, securely, and at very large scale.
Its business model is unusually straightforward. Registrars such as GoDaddy and others sell domain names to end customers, while VeriSign runs the back-end registry that keeps the domain database functioning. That creates recurring revenue because domains must be renewed regularly, and .com remains the most recognized web address worldwide.
The company’s revenue is heavily concentrated in domain name registry services. Based on company disclosures, the mix is approximately:
- .com registry services: about 85% to 90% of revenue. This is the core business and includes registration and renewal fees tied to .com domain names.
- .net registry services: about 10% to 12% of revenue. This is similar to .com but materially smaller.
- Other services: typically under 5% of revenue. This includes certain security-related and internet infrastructure services, such as root zone management work.
What stands out in the financial structure is how much of each revenue dollar remains after direct costs. Cost of revenue has stayed relatively low while revenue has continued to rise, allowing operating income to expand steadily over time.
Key Figures
| Metric | Value | Sector ⓘ |
|---|---|---|
| Date | Sep 12, 2026 | |
| Context | ||
| Sector | Technology | |
| Industry | Software - Infrastructure | |
| Market Cap ⓘ | $26.11B | |
| Beta ⓘ | 0.70 | |
Value (Cheapness) | ||
| P/E Ratio ⓘ | 31.16 | 29.51 |
| FCF Yield ⓘ | 4.08% | 4.25% |
| EBIT / EV ⓘ | 4.31% | 2.85% |
| PEG ⓘ | 2.64 | |
Growth (Business expansion) | ||
| Revenue Growth ⓘ | 6.00% | 15.40% |
| RPS Growth (5Y CAGR) ⓘ | 10.88% | 8.56% |
| EPS Growth (5Y CAGR) ⓘ | -7.72% | -11.88% |
| Margin Growth (5Y Trend) ⓘ | 3.64% | 0.46% |
| FCF Growth (5Y CAGR) ⓘ | 9.10% | 9.80% |
Quality (Business durability) | ||
| ROIC (Latest) ⓘ | N/A | 9.44% |
| ROIC (5Y Median) ⓘ | 299.90% | 8.30% |
| Net Debt / EBIT (Latest) ⓘ | 1.28 | 0.54 |
| Net Debt / EBIT (5Y Median) ⓘ | 1.48 | 0.44 |
| Operating Margin (Latest) ⓘ | 68.81% | 9.58% |
| Operating Margin (5Y Median) ⓘ | 68.83% | 8.25% |
| Debt to Equity (Latest) ⓘ | -103.82% | 33.33% |
| Profit Margin (Latest) ⓘ | 49.77% | 7.14% |
| Free Cash Flow (Latest) ⓘ | $1.07B | |
Momentum (Price trend) | ||
| 3Y Return ⓘ | +50.15% | +45.48% |
| 12M Return (excl. last month) ⓘ | +8.91% | +23.48% |
| 6M Return ⓘ | +25.18% | +20.93% |
| Price vs. 200-Day MA ⓘ | +12.08% | +7.43% |
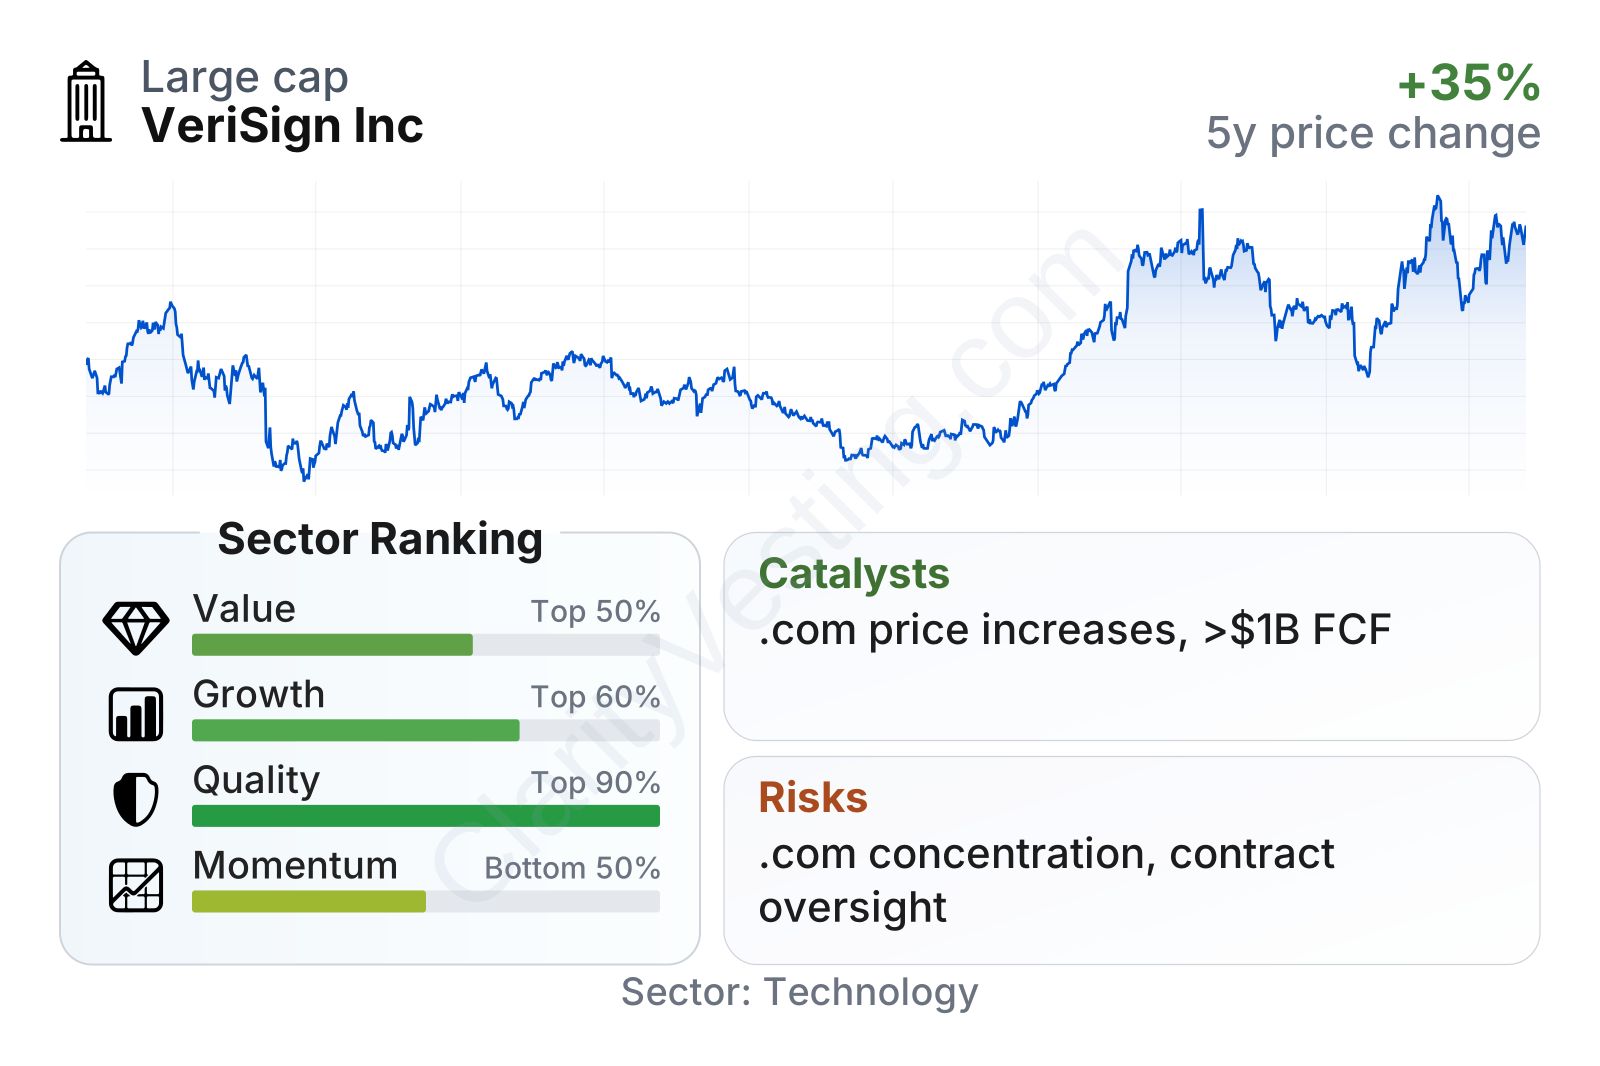
VeriSign is a large, established infrastructure software company with a relatively low beta, meaning its share price has historically moved less violently than many technology stocks. On valuation, it currently sits around the sector median on earnings and free cash flow yield, while its operating earnings relative to enterprise value look stronger than many peers. The most striking feature in the table is quality: margins and returns are far above typical software infrastructure companies, even though growth is only moderate and recent share-price momentum has been mixed.
Growth
VeriSign operates in a sector that is mature rather than fast-changing. Demand for domain names is linked to the broad health of online business, digital identity, entrepreneurship, and the need for permanent web presence. That is not the same as a high-growth cloud or artificial intelligence market, but it is a durable and essential part of the internet economy. For long-term analysis, that matters because durability can sometimes be more important than rapid expansion.
Revenue growth has generally remained in the mid-single-digit range, with some acceleration and deceleration across quarters. That is below the broader technology sector median, but it is still consistent and backed by a recurring revenue base rather than one-time contracts.
The company’s growth strategy is pragmatic. It depends mainly on three levers: the size of the domain base, renewal rates, and the pricing terms allowed under its registry agreements. That makes the business easier to understand than most technology companies. There is no need for a breakthrough product launch for the model to keep working; modest growth in registrations and renewals, combined with periodic price increases where permitted, can support steady expansion.
Cash generation has also improved meaningfully over time. Free cash flow has moved from roughly the mid-$700 million range a few years ago to above $1 billion on a trailing basis, which shows that revenue growth is translating into real cash and not being absorbed by heavy capital needs.
A notable catalyst is the pricing framework for .com. Under the current structure, VeriSign can implement certain price increases in specified years, subject to the terms of its agreements. Because .com is such a large share of the business, even moderate price changes can have a meaningful effect on revenue and profit. Another positive factor is the company’s central role in internet resilience and uptime, which supports its long-running customer relationships and makes the service difficult to replace operationally.
Recent company updates have continued to emphasize stable domain operations, high renewal activity, and disciplined capital returns. There has not been a transformative new opportunity announced that changes the entire outlook, but the existing framework itself remains an important economic engine.
Risks
This article is for informational purposes only and does not constitute financial advice. Some content is AI-generated. See Disclaimer


