Stock Analysis · Marriot Vacations Worldwide (VAC)
Overview
Marriott Vacations Worldwide is a vacation ownership company best known for selling timeshare interests and managing travel-related membership programs. It operates a portfolio of branded vacation ownership resorts and exchange networks, using brands licensed from Marriott International, Hilton, and Hyatt. In simple terms, the company helps customers buy long-term vacation usage rights, finances many of those purchases, and then earns recurring revenue from resort management, club dues, and exchange services.
The business is mainly organized around two segments: Vacation Ownership and Exchange & Third-Party Management. The first is the core engine and includes selling vacation ownership products, providing consumer financing, and operating resorts and clubs. The second includes exchange networks, membership programs, and management services for resorts and affiliated properties.
Based on recent company filings, revenue is heavily weighted toward the Vacation Ownership segment, with the Exchange & Third-Party Management segment contributing a much smaller share. Approximate revenue sources can be summarized as follows:
- Vacation ownership sales and related activities: about 75% to 80% of total revenue. This includes selling timeshare intervals, points-based ownership products, and revenue tied to these transactions.
- Financing revenue: about 8% to 12%. The company often finances customer purchases and earns interest income from those loans.
- Resort management, club dues, rentals, and ancillary services: about 7% to 10%. This includes fees for running resorts, servicing owners, and generating rental income from unused inventory.
- Exchange & Third-Party Management: about 10% to 15% of total revenue, depending on the period. This segment includes exchange memberships, transaction fees, and management services, led by Interval International.
The overall picture is that Marriott Vacations Worldwide is not a traditional hotel company. It is more exposed to consumer demand for prepaid leisure travel products, financing activity, and recurring fee income from a large installed owner base.
Over the last several years, revenue expanded from roughly $3.9 billion in 2021 to just above $5.0 billion in 2025, but the path has not been smooth. Gross profit and operating income weakened sharply in 2025 even as sales edged higher, showing that recent growth has not translated cleanly into profitability.
The income mix shows a business that can produce substantial gross profit in normal years, but it is also sensitive to cost swings, financing conditions, and one-time charges. That helps explain why revenue has held up better than earnings.
Key Figures
| Metric | Value | Sector ⓘ |
|---|---|---|
| Date | Sep 12, 2026 | |
| Context | ||
| Sector | Consumer Cyclical | |
| Industry | Resorts & Casinos | |
| Market Cap ⓘ | $3.56B | |
| Beta ⓘ | 1.24 | |
Value (Cheapness) | ||
| P/E Ratio ⓘ | N/A | 17.10 |
| FCF Yield ⓘ | 2.78% | 8.53% |
| EBIT / EV ⓘ | -2.35% | 6.46% |
| PEG ⓘ | 1.48 | |
Growth (Business expansion) | ||
| Revenue Growth ⓘ | 9.70% | 5.75% |
| RPS Growth (5Y CAGR) ⓘ | 12.55% | 9.14% |
| EPS Growth (5Y CAGR) ⓘ | -30.18% | -18.21% |
| Margin Growth (5Y Trend) ⓘ | -10.06% | -0.23% |
| FCF Growth (5Y CAGR) ⓘ | N/A | 4.91% |
Quality (Business durability) | ||
| ROIC (Latest) ⓘ | -2.73% | 12.61% |
| ROIC (5Y Median) ⓘ | 4.48% | 10.72% |
| Net Debt / EBIT (Latest) ⓘ | N/A | 2.10 |
| Net Debt / EBIT (5Y Median) ⓘ | 9.88 | 2.32 |
| Operating Margin (Latest) ⓘ | -4.35% | 9.25% |
| Operating Margin (5Y Median) ⓘ | 9.42% | 9.64% |
| Debt to Equity (Latest) ⓘ | 265.09% | 75.78% |
| Profit Margin (Latest) ⓘ | -9.78% | 5.33% |
| Free Cash Flow (Latest) ⓘ | $99.00M | |
Momentum (Price trend) | ||
| 3Y Return ⓘ | +14.25% | +14.53% |
| 12M Return (excl. last month) ⓘ | +69.68% | +3.08% |
| 6M Return ⓘ | +58.40% | +0.55% |
| Price vs. 200-Day MA ⓘ | +34.29% | -0.54% |
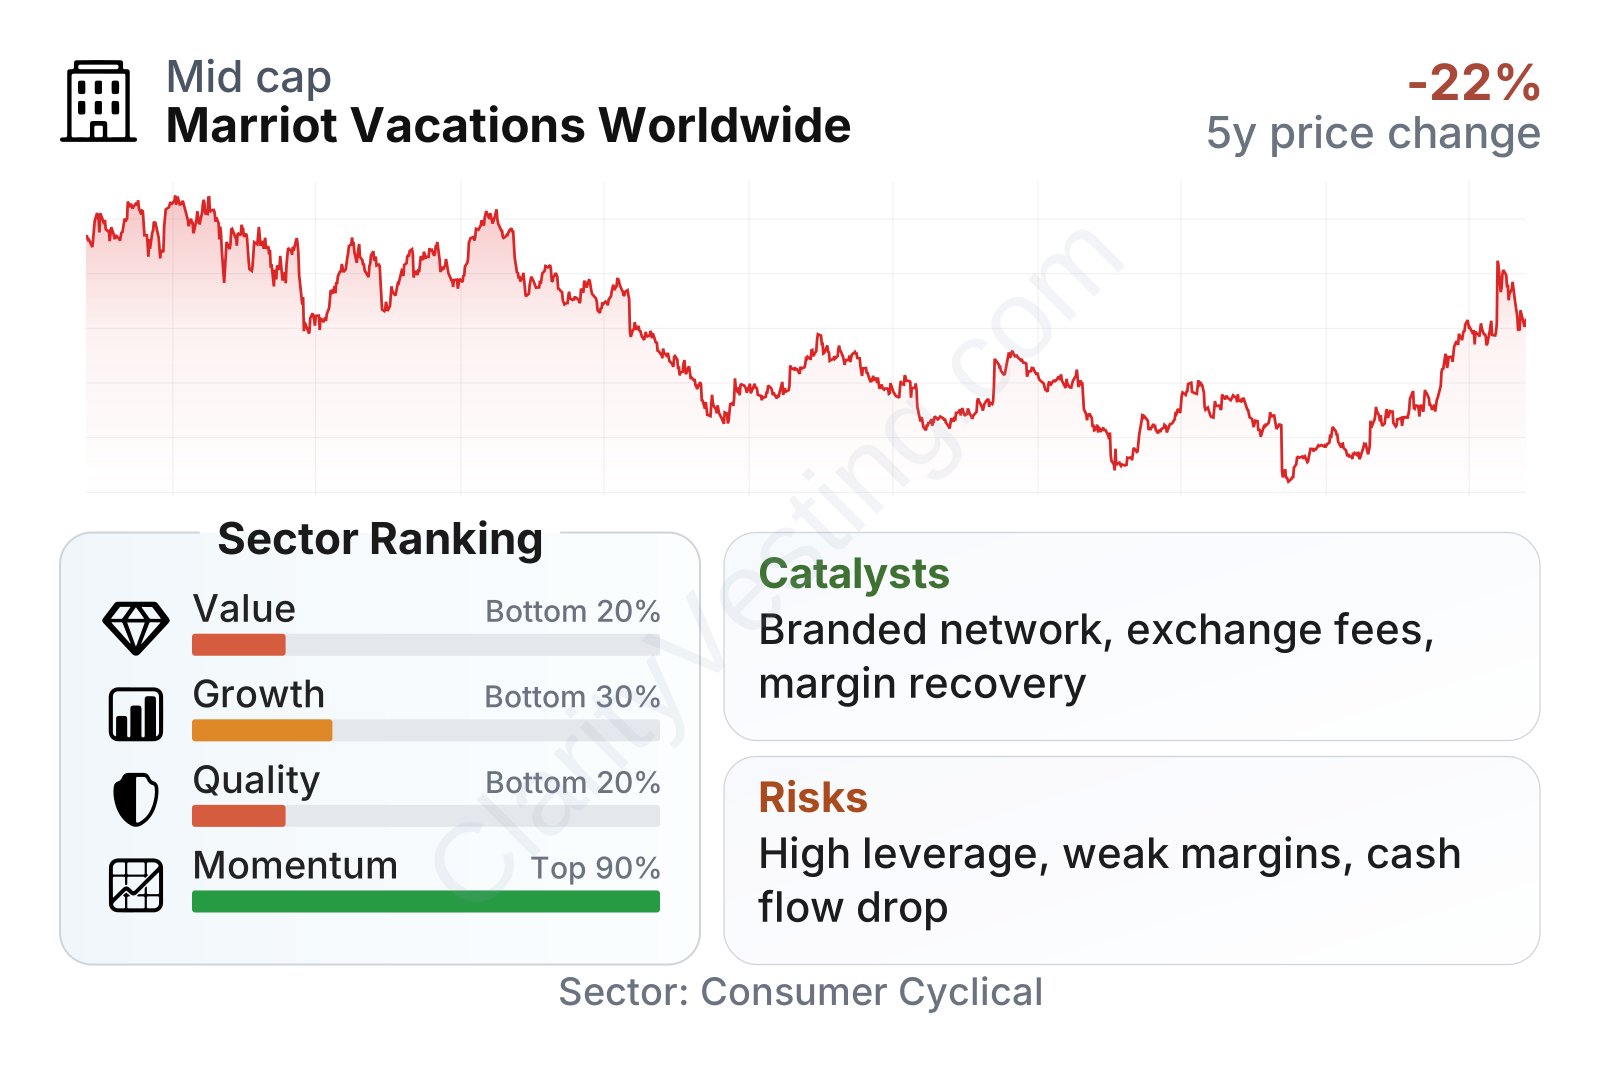
Marriott Vacations Worldwide is a mid-sized consumer discretionary company with above-average share price volatility. The recent factor profile is mixed: growth is better than many peers on a revenue basis, but value and quality rank weakly within the sector. In particular, leverage is high, profitability has deteriorated, and cash generation has softened. On the other hand, price momentum has been notably strong, meaning the market has recently become more optimistic even while operating metrics remain under pressure.
Growth
The company operates in a part of travel that still has long-term demand drivers. Leisure travel remains a structurally important spending category, and vacation ownership can benefit from households seeking repeat vacation access, branded experiences, and membership-style travel products. Exchange platforms also add a recurring component that is less cyclical than large one-time sales.
Its strategy broadly makes sense for growth because it combines three elements: recognized brands, a large owner base, and fee-based recurring businesses alongside sales. That mix can support expansion through new owner additions, more spending from existing members, and cross-selling between vacation ownership and exchange networks. The licensed relationships with Marriott, Hilton, and Hyatt are especially important because they reduce the need to build travel brands from scratch.
Recent revenue growth has returned to positive territory, running around the mid-single-digit range in the latest quarters. Over a five-year period, revenue per share growth has also outpaced the sector median. That said, the pattern has been uneven, with sharp swings from quarter to quarter. This suggests the company still has growth capacity, but it is not delivering a consistently smooth expansion profile.
Cash generation is the more cautious part of the growth picture. Free cash flow has trended down materially from the strong levels seen a few years ago and recently turned negative on a trailing basis. For a company that relies on development, marketing, and financing activity, weaker cash conversion can limit flexibility even when top-line growth remains positive.
A meaningful catalyst is the company’s ability to monetize its large member ecosystem more efficiently. If management improves loan performance, inventory mix, and cost control while keeping tour flow and owner engagement stable, earnings could recover faster than revenue. Another opportunity comes from the exchange and management platform, which is typically more asset-light and can provide steadier fee streams than pure interval sales.
Recent company communications have also emphasized product evolution, technology tools for owner engagement, and efforts to optimize inventory and financing operations. None of these are dramatic on their own, but together they point toward a practical path to improving the business without relying only on aggressive expansion.
Risks
This article is for informational purposes only and does not constitute financial advice. Some content is AI-generated. See Disclaimer


