Stock Analysis · Zillow Group Inc (ZG)

Overview
Zillow Group, Inc. operates a large online real estate marketplace in the United States. Its platforms (including Zillow, Trulia, and related brands) are used by people who want to browse homes, connect with real estate professionals, and get information about local housing markets. For professionals (agents, teams, and brokerages), Zillow provides tools and advertising products designed to help them reach home shoppers and manage leads.
In recent years, Zillow has emphasized building what it describes in its public filings as a more “connected” home shopping experience—aiming to reduce friction between browsing online and taking next steps (such as touring, speaking to an agent, or financing). The company also runs a mortgage business and other smaller offerings that support the broader home-buying and home-selling journey.
Zillow’s revenue is mainly generated from services sold to real estate professionals and, to a smaller extent, mortgage-related activities and other services. Based on the company’s segment reporting in its annual filings, the main revenue sources are typically:
- Residential (the largest): primarily advertising and lead-generation products for real estate agents, teams, and brokerages.
- Mortgages: mortgage origination and related sales (including the sale of originated loans), plus advertising in some cases.
- Other: smaller lines that may include rentals marketplace activity and other services (depending on how the company reports segments in a given year).
The revenue and cost structure shown above highlights a business with substantial operating expenses (notably product development and sales/marketing-related costs). Over time, revenue has expanded from the 2022–2023 level to a higher 2025 level, while net income moved from losses to a small profit in 2025—suggesting progress toward improved profitability even as spending remains significant.
Key Figures
| Metric | Value | Industry ⓘ |
|---|---|---|
| Date | May 11, 2026 | |
| Context | ||
| Sector | Communication Services | |
| Industry | Internet Content & Information | |
| Market Cap ⓘ | $9.60B | |
| Beta ⓘ | 2.04 | |
| Fundamental | ||
| P/E Ratio ⓘ | 167.76 | 15.72 |
| Profit Margin ⓘ | 2.27% | 9.47% |
| Revenue Growth ⓘ | 18.40% | 6.40% |
| Debt to Equity ⓘ | 9.73% | 8.92% |
| PEG ⓘ | 0.92 | |
| Free Cash Flow ⓘ | $331.00M | |
Zillow’s market capitalization is about $9.6B, placing it in the mid-cap range. The stock’s beta of ~2.04 indicates it has historically moved more than the broader market, which can matter for long-term holders who prefer steadier price swings. The company shows year-over-year revenue growth of ~18.4%, which is higher than the industry median shown (~6.4%). Profitability is still relatively thin: the latest profit margin is ~2.3%, below the industry median shown (~9.5%). Balance-sheet leverage looks modest, with debt-to-equity of ~9.7%, close to the industry median shown. Free cash flow over the last twelve months is about $331M, indicating the business has recently generated cash after operating costs and capital spending.
Growth (Medium)
Zillow sits at the intersection of housing and digital advertising/marketplaces. Housing transaction volumes can be cyclical (rising and falling with mortgage rates, affordability, and consumer confidence), but the long-term shift toward shopping for homes online has been a durable trend. As more of the customer journey happens digitally, platforms that aggregate demand (home shoppers) can be valuable partners to supply (agents, brokerages, and related service providers).
A key part of Zillow’s growth strategy, as described in its filings, is to deepen engagement and conversion—turning casual browsing into higher-intent actions (contacting an agent, scheduling a tour, starting financing steps). If successful, that can support higher monetization per user and more predictable demand from real estate professionals, because advertising and lead products tend to be more valuable when they produce measurable outcomes.
The year-over-year revenue growth trend has improved meaningfully from the declines seen in 2022 and early 2023 to sustained positive growth through 2024–2026, reaching roughly the high-teens most recently. That pattern is consistent with a recovery phase after a weak period for parts of the housing ecosystem.
Free cash flow has also shown a notable swing: from negative in 2022 to strongly positive in 2023, and then stabilizing at positive levels through 2024–2026 (about $331M most recently). For long-term business building, sustained positive free cash flow can provide flexibility to invest in product improvements while maintaining financial resilience through housing slowdowns.
Risks (High)
Zillow’s results are exposed to the health of the U.S. housing market and the advertising budgets of real estate professionals. When home sales slow, agents and brokerages may reduce spending, and consumers may delay moving—both of which can pressure marketplace activity and revenue growth. This cyclicality is important because it can create periods where operational progress is harder to see in reported results, even if product engagement remains solid.
Competition is another central risk. Zillow competes for audience attention (home shoppers) and for industry spending (agent/broker marketing dollars). Key competitors and adjacent alternatives include large real estate portals and listing networks, as well as companies offering agent marketing software, CRM tools, and lead generation. In addition, major search engines and social platforms can compete for advertising budgets indirectly. Zillow’s scale and brand recognition are meaningful advantages, but competition can affect pricing power and customer retention.
Profitability remains a key execution risk. Zillow invests heavily in product development and go-to-market activities, and historically it has experienced periods of losses. Even with improving margins recently, sustaining profitability may depend on maintaining growth while keeping operating costs disciplined.
Debt-to-equity has come down substantially versus earlier peaks (for example, it was much higher in 2021–2023) and is now around 9.7%, roughly in line with the industry median shown. Lower leverage can reduce financial risk during weaker housing cycles, though it does not remove revenue cyclicality.
Profit margin has improved from negative levels over multiple years to about 2.3% most recently. However, it remains below the industry median shown (about 8.6%), indicating Zillow is still earlier in building consistently higher profitability compared with some peers in its broader industry grouping.
Valuation
The latest price-to-earnings (P/E) ratio shown is about 167.8, compared with an industry median around 15.7. A high P/E can occur when a company’s current earnings are relatively small (making the “E” in P/E low), even if revenue is growing and profitability is improving. In Zillow’s case, the combination of recently thin profit margins and a return to positive net income can mechanically push the P/E higher.
The historical P/E display also shows that Zillow’s P/E is not consistently available at meaningful levels across the full timeline (often due to losses in earlier periods, when a standard P/E becomes less informative). This makes it harder to rely on P/E alone when comparing valuation over time. In practice, valuation discussions for businesses transitioning from losses toward profitability often incorporate additional context such as revenue growth, margin trajectory, and cash generation—especially when earnings are still stabilizing.
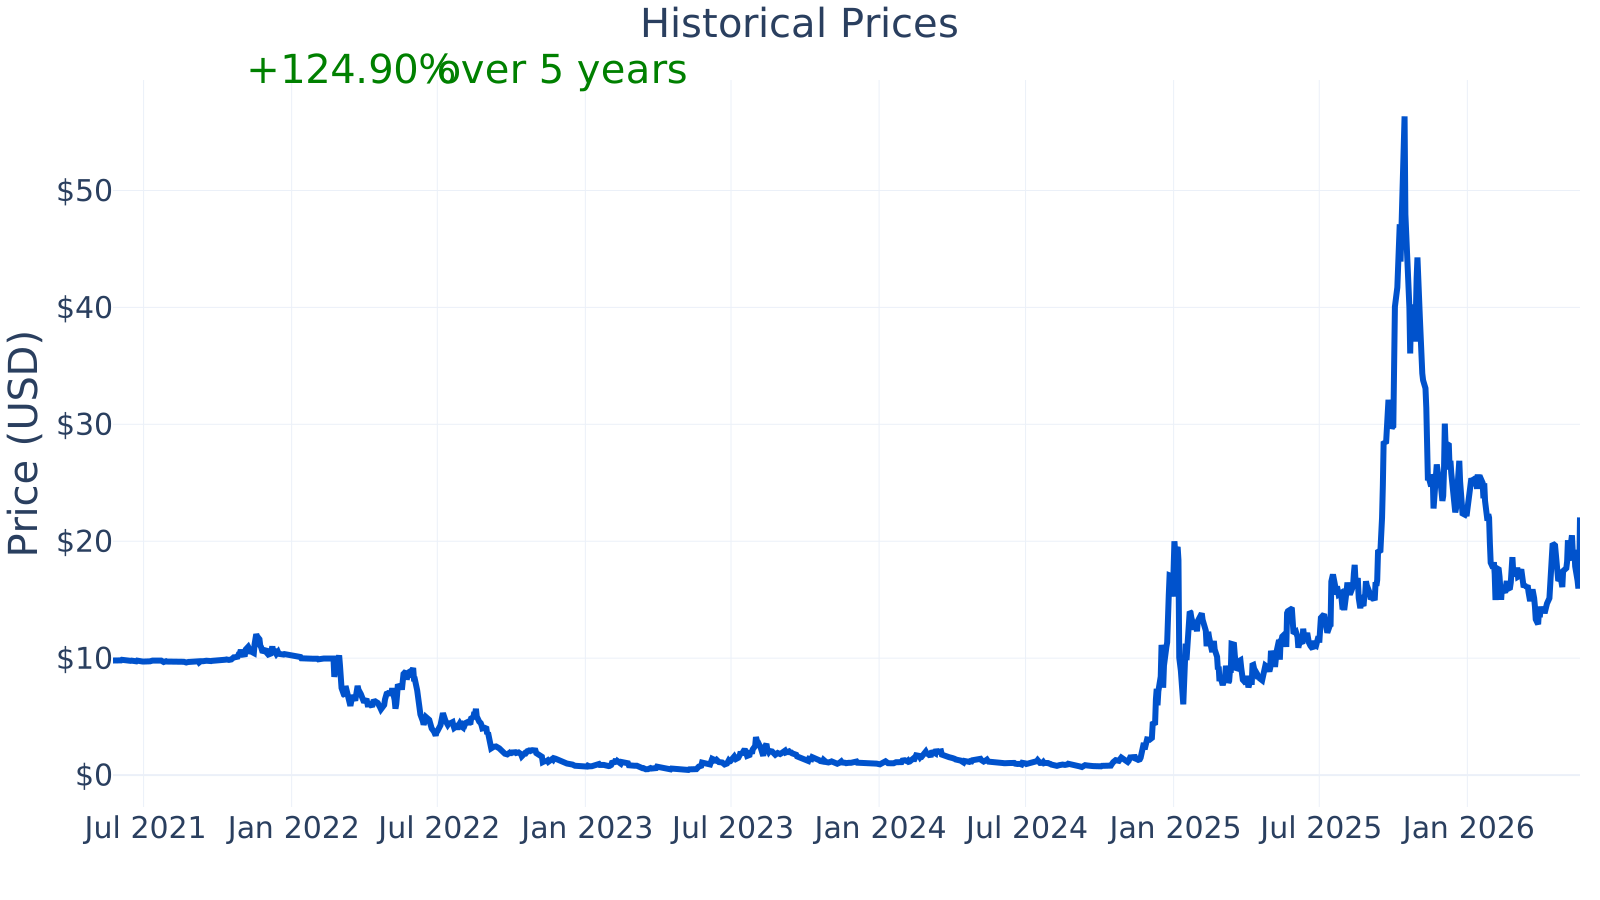
Given the company’s higher volatility (beta above 2), housing-cycle exposure, and still-developing margin profile, market pricing can be sensitive to changes in expectations around transaction volumes, advertising demand, and the pace of profitability improvement.
Conclusion
Zillow is a major online real estate marketplace focused on connecting home shoppers with real estate professionals and related services. The company has returned to stronger year-over-year revenue growth and has generated positive free cash flow in recent periods, while leverage appears modest.
At the same time, Zillow operates in a cycle-sensitive environment tied to housing activity and competitive dynamics in digital real estate and advertising. Profitability has improved but remains comparatively low versus the industry median shown, which helps explain why earnings-based valuation measures can look elevated. Overall, the long-term picture depends heavily on continued execution toward durable profitability and on how resilient demand proves to be across housing cycles.
Sources:
- SEC EDGAR — Zillow Group, Inc. Form 10-K (Annual Report) (business description, segment information, risk factors, financial statements)
- SEC EDGAR — Zillow Group, Inc. Form 10-Q (Quarterly Reports) (updates to results, risks, and financial statements)
- Zillow Group Investor Relations — Shareholder materials and earnings releases (company-hosted)
- Wikipedia — “Zillow” and “Zillow Group” (basic company background)
This article is for informational purposes only and does not constitute financial advice. Some content is AI-generated. See Disclaimer